
 Yahoo Finance
 What Is FONAR's (NASDAQ:FONR) P/E Ratio After Its Share Price Rocketed?

Those holding FONAR (NASDAQ:FONR) shares must be pleased that the share price has rebounded 37% in the last thirty days. But unfortunately, the stock is still down by 20% over a quarter. But shareholders may not all be feeling jubilant, since the share price is still down 16% in the last year.
Assuming no other changes, a sharply higher share price makes a stock less attractive to potential buyers. While the market sentiment towards a stock is very changeable, in the long run, the share price will tend to move in the same direction as earnings per share. The implication here is that deep value investors might steer clear when expectations of a company are too high. One way to gauge market expectations of a stock is to look at its Price to Earnings Ratio (PE Ratio). A high P/E ratio means that investors have a high expectation about future growth, while a low P/E ratio means they have low expectations about future growth.
Check out our latest analysis for FONAR
Does FONAR Have A Relatively High Or Low P/E For Its Industry?
We can tell from its P/E ratio of 7.74 that sentiment around FONAR isn't particularly high. We can see in the image below that the average P/E (42.7) for companies in the medical equipment industry is higher than FONAR's P/E.
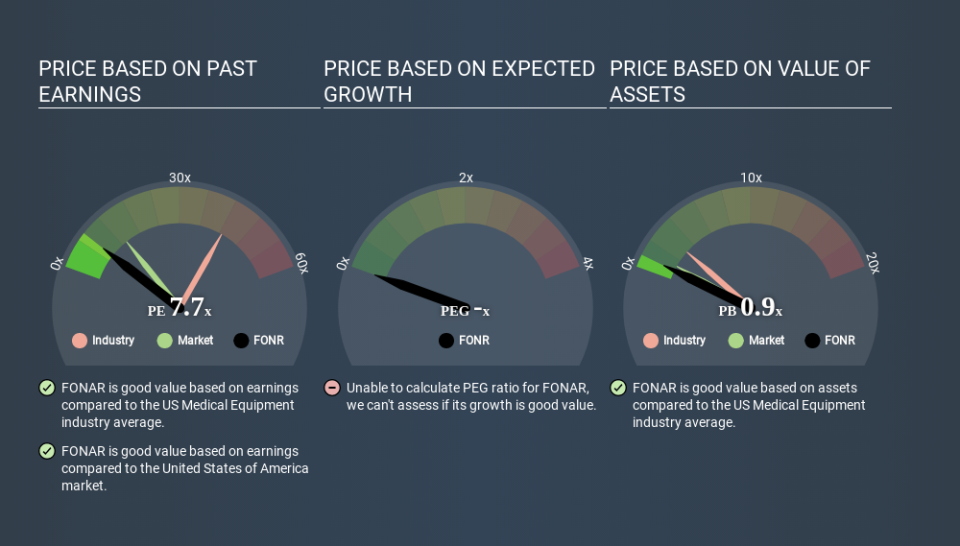
Its relatively low P/E ratio indicates that FONAR shareholders think it will struggle to do as well as other companies in its industry classification. While current expectations are low, the stock could be undervalued if the situation is better than the market assumes. It is arguably worth checking if insiders are buying shares, because that might imply they believe the stock is undervalued.
How Growth Rates Impact P/E Ratios
If earnings fall then in the future the 'E' will be lower. Therefore, even if you pay a low multiple of earnings now, that multiple will become higher in the future. A higher P/E should indicate the stock is expensive relative to others -- and that may encourage shareholders to sell.
FONAR shrunk earnings per share by 27% over the last year. But EPS is up 4.7% over the last 5 years. And it has shrunk its earnings per share by 6.4% per year over the last three years. This might lead to low expectations.
A Limitation: P/E Ratios Ignore Debt and Cash In The Bank
The 'Price' in P/E reflects the market capitalization of the company. That means it doesn't take debt or cash into account. Theoretically, a business can improve its earnings (and produce a lower P/E in the future) by investing in growth. That means taking on debt (or spending its cash).
While growth expenditure doesn't always pay off, the point is that it is a good option to have; but one that the P/E ratio ignores.
Is Debt Impacting FONAR's P/E?
FONAR has net cash of US$30m. This is fairly high at 28% of its market capitalization. That might mean balance sheet strength is important to the business, but should also help push the P/E a bit higher than it would otherwise be.
The Verdict On FONAR's P/E Ratio
FONAR trades on a P/E ratio of 7.7, which is below the US market average of 13.5. Falling earnings per share are likely to be keeping potential buyers away, the relatively strong balance sheet will allow the company time to invest in growth. If it achieves that, then there's real potential that the low P/E could eventually indicate undervaluation. What we know for sure is that investors are becoming less uncomfortable about FONAR's prospects, since they have pushed its P/E ratio from 5.6 to 7.7 over the last month. For those who like to invest in turnarounds, that might mean it's time to put the stock on a watchlist, or research it. But others might consider the opportunity to have passed.
When the market is wrong about a stock, it gives savvy investors an opportunity. If the reality for a company is not as bad as the P/E ratio indicates, then the share price should increase as the market realizes this. We don't have analyst forecasts, but you might want to assess this data-rich visualization of earnings, revenue and cash flow.
Of course you might be able to find a better stock than FONAR. So you may wish to see this free collection of other companies that have grown earnings strongly.
If you spot an error that warrants correction, please contact the editor at editorial-team@simplywallst.com. This article by Simply Wall St is general in nature. It does not constitute a recommendation to buy or sell any stock, and does not take account of your objectives, or your financial situation. Simply Wall St has no position in the stocks mentioned.
We aim to bring you long-term focused research analysis driven by fundamental data. Note that our analysis may not factor in the latest price-sensitive company announcements or qualitative material. Thank you for reading.
