
 Yahoo Finance
 Do Its Financials Have Any Role To Play In Driving Direct Line Insurance Group plc's (LON:DLG) Stock Up Recently?
Most readers would already be aware that Direct Line Insurance Group's (LON:DLG) stock increased significantly by 8.8% over the past month. We wonder if and what role the company's financials play in that price change as a company's long-term fundamentals usually dictate market outcomes. Specifically, we decided to study Direct Line Insurance Group's ROE in this article.
ROE or return on equity is a useful tool to assess how effectively a company can generate returns on the investment it received from its shareholders. In other words, it is a profitability ratio which measures the rate of return on the capital provided by the company's shareholders.
See our latest analysis for Direct Line Insurance Group
How Do You Calculate Return On Equity?
The formula for return on equity is:
Return on Equity = Net Profit (from continuing operations) ÷ Shareholders' Equity
So, based on the above formula, the ROE for Direct Line Insurance Group is:
11% = UK£286m ÷ UK£2.6b (Based on the trailing twelve months to June 2022).
The 'return' is the amount earned after tax over the last twelve months. One way to conceptualize this is that for each £1 of shareholders' capital it has, the company made £0.11 in profit.
What Is The Relationship Between ROE And Earnings Growth?
So far, we've learned that ROE is a measure of a company's profitability. Based on how much of its profits the company chooses to reinvest or "retain", we are then able to evaluate a company's future ability to generate profits. Assuming all else is equal, companies that have both a higher return on equity and higher profit retention are usually the ones that have a higher growth rate when compared to companies that don't have the same features.
Direct Line Insurance Group's Earnings Growth And 11% ROE
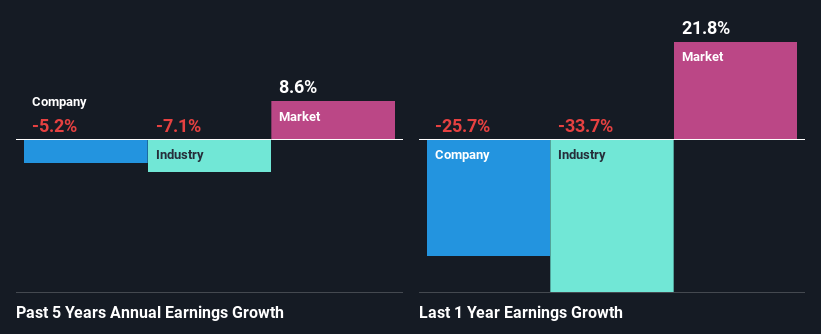
To start with, Direct Line Insurance Group's ROE looks acceptable. And on comparing with the industry, we found that the the average industry ROE is similar at 10%. For this reason, Direct Line Insurance Group's five year net income decline of 5.2% raises the question as to why the decent ROE didn't translate into growth. We reckon that there could be some other factors at play here that are preventing the company's growth. Such as, the company pays out a huge portion of its earnings as dividends, or is faced with competitive pressures.
Next, we compared Direct Line Insurance Group's performance against the industry and found that the industry shrunk its earnings at 7.1% in the same period, which suggests that the company's earnings have been shrinking at a slower rate than its industry, While this is not particularly good, its not particularly bad either.
Earnings growth is a huge factor in stock valuation. The investor should try to establish if the expected growth or decline in earnings, whichever the case may be, is priced in. By doing so, they will have an idea if the stock is headed into clear blue waters or if swampy waters await. If you're wondering about Direct Line Insurance Group's's valuation, check out this gauge of its price-to-earnings ratio, as compared to its industry.
Is Direct Line Insurance Group Using Its Retained Earnings Effectively?
Direct Line Insurance Group has a high three-year median payout ratio of 83% (that is, it is retaining 17% of its profits). This suggests that the company is paying most of its profits as dividends to its shareholders. This goes some way in explaining why its earnings have been shrinking. The business is only left with a small pool of capital to reinvest - A vicious cycle that doesn't benefit the company in the long-run.
Additionally, Direct Line Insurance Group has paid dividends over a period of at least ten years, which means that the company's management is determined to pay dividends even if it means little to no earnings growth. Based on the latest analysts' estimates, we found that the company's future payout ratio over the next three years is expected to hold steady at 73%. Still, forecasts suggest that Direct Line Insurance Group's future ROE will rise to 16% even though the the company's payout ratio is not expected to change by much.
Summary
In total, it does look like Direct Line Insurance Group has some positive aspects to its business. Although, we are disappointed to see a lack of growth in earnings even in spite of a high ROE. Bear in mind, the company reinvests a small portion of its profits, which means that investors aren't reaping the benefits of the high rate of return. That being so, the latest industry analyst forecasts show that the analysts are expecting to see a huge improvement in the company's earnings growth rate. Are these analysts expectations based on the broad expectations for the industry, or on the company's fundamentals? Click here to be taken to our analyst's forecasts page for the company.
Have feedback on this article? Concerned about the content? Get in touch with us directly. Alternatively, email editorial-team (at) simplywallst.com.
This article by Simply Wall St is general in nature. We provide commentary based on historical data and analyst forecasts only using an unbiased methodology and our articles are not intended to be financial advice. It does not constitute a recommendation to buy or sell any stock, and does not take account of your objectives, or your financial situation. We aim to bring you long-term focused analysis driven by fundamental data. Note that our analysis may not factor in the latest price-sensitive company announcements or qualitative material. Simply Wall St has no position in any stocks mentioned.
Join A Paid User Research Session
You’ll receive a US$30 Amazon Gift card for 1 hour of your time while helping us build better investing tools for the individual investors like yourself. Sign up here
