
 Yahoo Finance
 How Financially Strong Is U.S. Silica Holdings, Inc. (NYSE:SLCA)?

Want to participate in a short research study? Help shape the future of investing tools and you could win a $250 gift card!
While small-cap stocks, such as U.S. Silica Holdings, Inc. (NYSE:SLCA) with its market cap of US$992m, are popular for their explosive growth, investors should also be aware of their balance sheet to judge whether the company can survive a downturn. Since SLCA is loss-making right now, it’s vital to evaluate the current state of its operations and pathway to profitability. We'll look at some basic checks that can form a snapshot the company’s financial strength. Nevertheless, this is not a comprehensive overview, so I recommend you dig deeper yourself into SLCA here.
SLCA’s Debt (And Cash Flows)
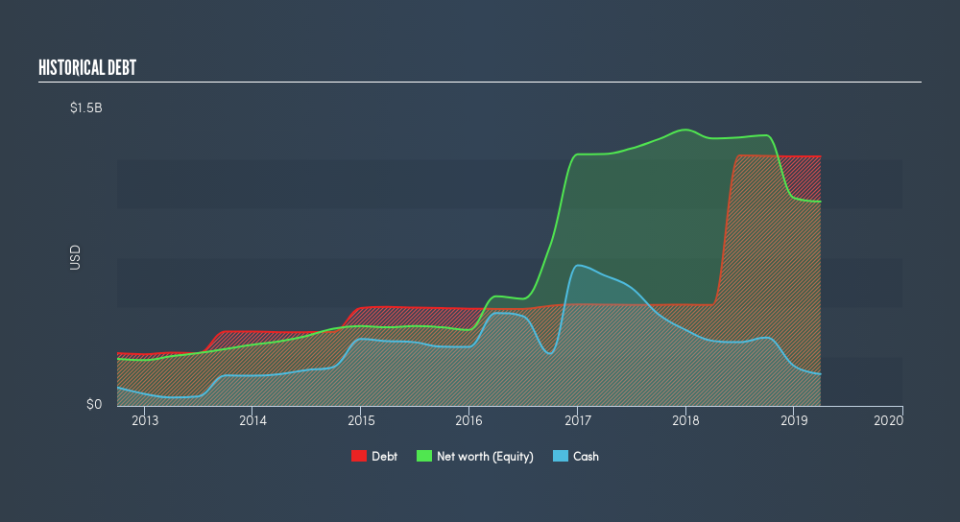
Over the past year, SLCA has ramped up its debt from US$512m to US$1.5b , which includes long-term debt. With this rise in debt, SLCA's cash and short-term investments stands at US$162m , ready to be used for running the business. Additionally, SLCA has generated US$244m in operating cash flow during the same period of time, resulting in an operating cash to total debt ratio of 17%, meaning that SLCA’s debt is not covered by operating cash.
Can SLCA meet its short-term obligations with the cash in hand?
At the current liabilities level of US$327m, the company has maintained a safe level of current assets to meet its obligations, with the current ratio last standing at 1.77x. The current ratio is the number you get when you divide current assets by current liabilities. Generally, for Energy Services companies, this is a reasonable ratio since there is a bit of a cash buffer without leaving too much capital in a low-return environment.
Does SLCA face the risk of succumbing to its debt-load?
With total debt exceeding equity, SLCA is considered a highly levered company. This is a bit unusual for a small-cap stock, since they generally have a harder time borrowing than large more established companies. Though, since SLCA is currently unprofitable, sustainability of its current state of operations becomes a concern. Maintaining a high level of debt, while revenues are still below costs, can be dangerous as liquidity tends to dry up in unexpected downturns.
Next Steps:
Although SLCA’s debt level is towards the higher end of the spectrum, its cash flow coverage seems adequate to meet obligations which means its debt is being efficiently utilised. Since there is also no concerns around SLCA's liquidity needs, this may be its optimal capital structure for the time being. This is only a rough assessment of financial health, and I'm sure SLCA has company-specific issues impacting its capital structure decisions. You should continue to research U.S. Silica Holdings to get a more holistic view of the small-cap by looking at:
Future Outlook: What are well-informed industry analysts predicting for SLCA’s future growth? Take a look at our free research report of analyst consensus for SLCA’s outlook.
Valuation: What is SLCA worth today? Is the stock undervalued, even when its growth outlook is factored into its intrinsic value? The intrinsic value infographic in our free research report helps visualize whether SLCA is currently mispriced by the market.
Other High-Performing Stocks: Are there other stocks that provide better prospects with proven track records? Explore our free list of these great stocks here.
We aim to bring you long-term focused research analysis driven by fundamental data. Note that our analysis may not factor in the latest price-sensitive company announcements or qualitative material.
If you spot an error that warrants correction, please contact the editor at editorial-team@simplywallst.com. This article by Simply Wall St is general in nature. It does not constitute a recommendation to buy or sell any stock, and does not take account of your objectives, or your financial situation. Simply Wall St has no position in the stocks mentioned. Thank you for reading.
