
 Yahoo Finance
 How Financially Strong Is Tree Island Steel Ltd. (TSE:TSL)?

Want to participate in a short research study? Help shape the future of investing tools and you could win a $250 gift card!
While small-cap stocks, such as Tree Island Steel Ltd. (TSE:TSL) with its market cap of CA$58m, are popular for their explosive growth, investors should also be aware of their balance sheet to judge whether the company can survive a downturn. Assessing first and foremost the financial health is essential, as mismanagement of capital can lead to bankruptcies, which occur at a higher rate for small-caps. The following basic checks can help you get a picture of the company's balance sheet strength. However, this is just a partial view of the stock, and I’d encourage you to dig deeper yourself into TSL here.
Does TSL Produce Much Cash Relative To Its Debt?
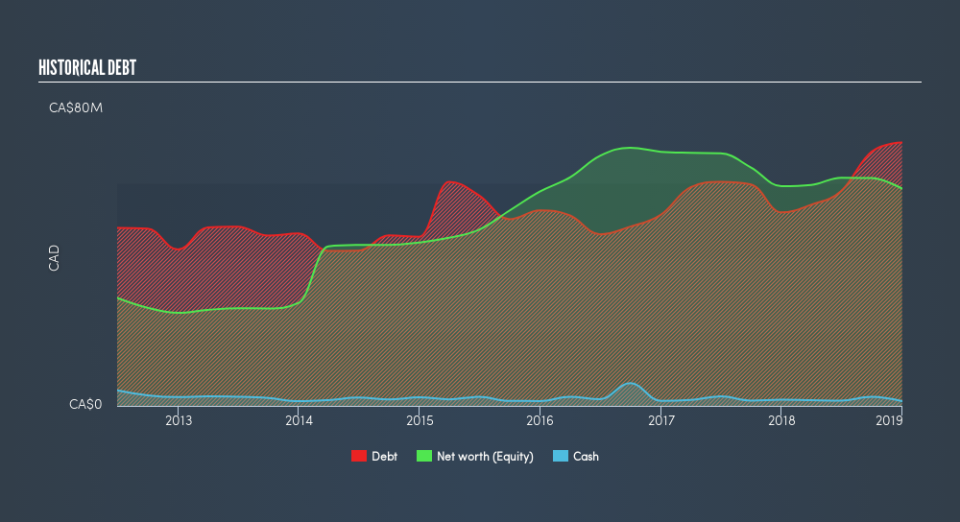
TSL's debt levels surged from CA$52m to CA$71m over the last 12 months – this includes long-term debt. With this growth in debt, TSL's cash and short-term investments stands at CA$1.3m to keep the business going. Its negative operating cash flow means calculating cash-to-debt wouldn't be useful. As the purpose of this article is a high-level overview, I won’t be looking at this today, but you can assess some of TSL’s operating efficiency ratios such as ROA here.
Does TSL’s liquid assets cover its short-term commitments?
With current liabilities at CA$78m, it seems that the business has maintained a safe level of current assets to meet its obligations, with the current ratio last standing at 1.43x. The current ratio is calculated by dividing current assets by current liabilities. Usually, for Metals and Mining companies, this is a suitable ratio since there's a sufficient cash cushion without leaving too much capital idle or in low-earning investments.
Is TSL’s debt level acceptable?
With total debt exceeding equity, TSL is considered a highly levered company. This is somewhat unusual for small-caps companies, since lenders are often hesitant to provide attractive interest rates to less-established businesses. We can test if TSL’s debt levels are sustainable by measuring interest payments against earnings of a company. Ideally, earnings before interest and tax (EBIT) should cover net interest by at least three times. For TSL, the ratio of 2.63x suggests that interest is not strongly covered, which means that lenders may be more reluctant to lend out more funding as TSL’s low interest coverage already puts the company at higher risk of default.
Next Steps:
Although TSL’s debt level is towards the higher end of the spectrum, its cash flow coverage seems adequate to meet obligations which means its debt is being efficiently utilised. This may mean this is an optimal capital structure for the business, given that it is also meeting its short-term commitment. Keep in mind I haven't considered other factors such as how TSL has been performing in the past. I suggest you continue to research Tree Island Steel to get a better picture of the small-cap by looking at:
Historical Performance: What has TSL's returns been like over the past? Go into more detail in the past track record analysis and take a look at the free visual representations of our analysis for more clarity.
Other High-Performing Stocks: Are there other stocks that provide better prospects with proven track records? Explore our free list of these great stocks here.
We aim to bring you long-term focused research analysis driven by fundamental data. Note that our analysis may not factor in the latest price-sensitive company announcements or qualitative material.
If you spot an error that warrants correction, please contact the editor at editorial-team@simplywallst.com. This article by Simply Wall St is general in nature. It does not constitute a recommendation to buy or sell any stock, and does not take account of your objectives, or your financial situation. Simply Wall St has no position in the stocks mentioned. Thank you for reading.
