
 Yahoo Finance
 How Financially Strong Is Safran SA (EPA:SAF)?

Want to participate in a short research study? Help shape the future of investing tools and you could win a $250 gift card!
Safran SA (EPA:SAF), a large-cap worth €53b, comes to mind for investors seeking a strong and reliable stock investment. Doing business globally, large caps tend to have diversified revenue streams and attractive capital returns, making them desirable investments for risk-averse portfolios. But, its financial health remains the key to continued success. This article will examine Safran’s financial liquidity and debt levels to get an idea of whether the company can deal with cyclical downturns and maintain funds to accommodate strategic spending for future growth. Note that this information is centred entirely on financial health and is a high-level overview, so I encourage you to look further into SAF here.
View our latest analysis for Safran
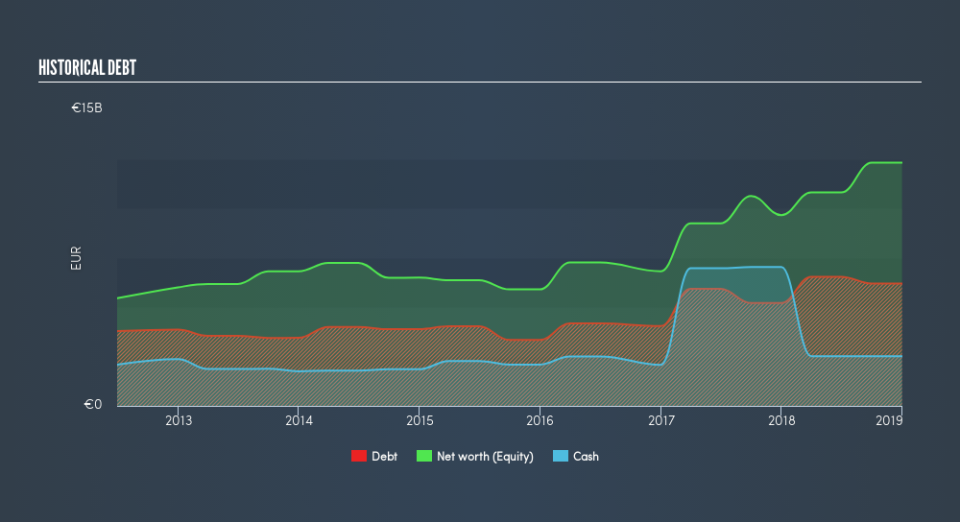
Does SAF Produce Much Cash Relative To Its Debt?
SAF has built up its total debt levels in the last twelve months, from €5.2b to €6.2b , which includes long-term debt. With this increase in debt, SAF currently has €2.5b remaining in cash and short-term investments to keep the business going. Moreover, SAF has produced €3.1b in operating cash flow in the last twelve months, resulting in an operating cash to total debt ratio of 50%, meaning that SAF’s current level of operating cash is high enough to cover debt.
Can SAF meet its short-term obligations with the cash in hand?
Looking at SAF’s €21b in current liabilities, the company arguably has a rather low level of current assets relative its obligations, with the current ratio last standing at 0.86x. The current ratio is calculated by dividing current assets by current liabilities.
Does SAF face the risk of succumbing to its debt-load?
SAF is a relatively highly levered company with a debt-to-equity of 50%. This is not unusual for large-caps since debt tends to be less expensive than equity because interest payments are tax deductible. Accordingly, large companies often have an advantage over small-caps through lower cost of capital due to cheaper financing. We can check to see whether SAF is able to meet its debt obligations by looking at the net interest coverage ratio. Net interest should be covered by earnings before interest and tax (EBIT) by at least three times to be safe. For SAF, the ratio of 31.82x suggests that interest is amply covered. It is considered a responsible and reassuring practice to maintain high interest coverage, which makes SAF and other large-cap investments thought to be safe.
Next Steps:
Although SAF’s debt level is towards the higher end of the spectrum, its cash flow coverage seems adequate to meet debt obligations which means its debt is being efficiently utilised. However, its low liquidity raises concerns over whether current asset management practices are properly implemented for the large-cap. I admit this is a fairly basic analysis for SAF's financial health. Other important fundamentals need to be considered alongside. I recommend you continue to research Safran to get a more holistic view of the stock by looking at:
Future Outlook: What are well-informed industry analysts predicting for SAF’s future growth? Take a look at our free research report of analyst consensus for SAF’s outlook.
Valuation: What is SAF worth today? Is the stock undervalued, even when its growth outlook is factored into its intrinsic value? The intrinsic value infographic in our free research report helps visualize whether SAF is currently mispriced by the market.
Other High-Performing Stocks: Are there other stocks that provide better prospects with proven track records? Explore our free list of these great stocks here.
We aim to bring you long-term focused research analysis driven by fundamental data. Note that our analysis may not factor in the latest price-sensitive company announcements or qualitative material.
If you spot an error that warrants correction, please contact the editor at editorial-team@simplywallst.com. This article by Simply Wall St is general in nature. It does not constitute a recommendation to buy or sell any stock, and does not take account of your objectives, or your financial situation. Simply Wall St has no position in the stocks mentioned. Thank you for reading.
