
 Yahoo Finance
 How Financially Strong Is Lookers plc (LON:LOOK)?

While small-cap stocks, such as Lookers plc (LON:LOOK) with its market cap of UK£428.4m, are popular for their explosive growth, investors should also be aware of their balance sheet to judge whether the company can survive a downturn. Companies operating in the Specialty Retail industry facing headwinds from current disruption, even ones that are profitable, are more likely to be higher risk. Evaluating financial health as part of your investment thesis is crucial. Here are a few basic checks that are good enough to have a broad overview of the company’s financial strength. However, since I only look at basic financial figures, I suggest you dig deeper yourself into LOOK here.
How does LOOK’s operating cash flow stack up against its debt?
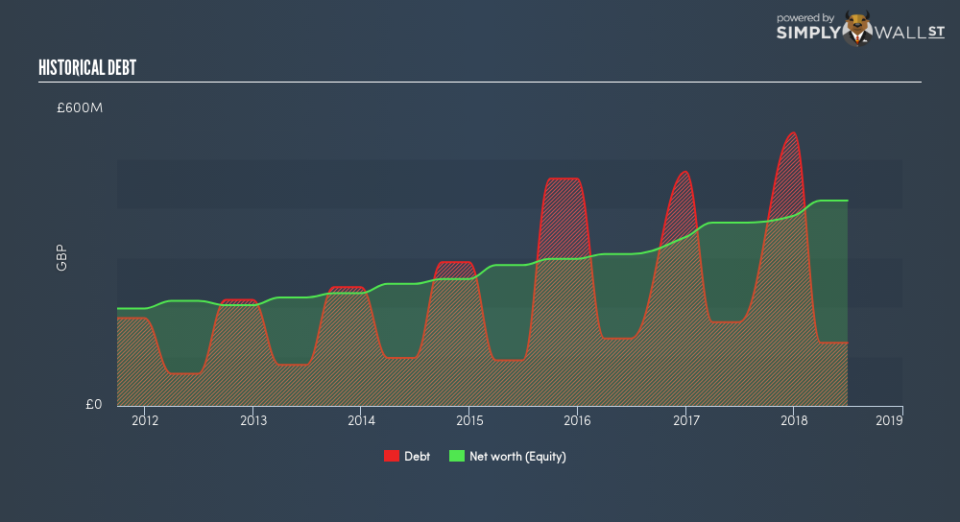
LOOK has shrunken its total debt levels in the last twelve months, from UK£169.6m to UK£127.5m , which comprises of short- and long-term debt. With this reduction in debt, LOOK’s cash and short-term investments stands at UK£47.9m , ready to deploy into the business. Additionally, LOOK has generated cash from operations of UK£38.1m in the last twelve months, leading to an operating cash to total debt ratio of 29.9%, signalling that LOOK’s debt is appropriately covered by operating cash. This ratio can also be a sign of operational efficiency as an alternative to return on assets. In LOOK’s case, it is able to generate 0.3x cash from its debt capital.
Does LOOK’s liquid assets cover its short-term commitments?
Looking at LOOK’s most recent UK£1.18b liabilities, it seems that the business has been able to meet these obligations given the level of current assets of UK£1.23b, with a current ratio of 1.04x. Generally, for Specialty Retail companies, this is a reasonable ratio since there is a bit of a cash buffer without leaving too much capital in a low-return environment.
Does LOOK face the risk of succumbing to its debt-load?
LOOK’s level of debt is appropriate relative to its total equity, at 30.7%. This range is considered safe as LOOK is not taking on too much debt obligation, which can be restrictive and risky for equity-holders. We can test if LOOK’s debt levels are sustainable by measuring interest payments against earnings of a company. Ideally, earnings before interest and tax (EBIT) should cover net interest by at least three times. For LOOK, the ratio of 4.27x suggests that interest is appropriately covered, which means that debtors may be willing to loan the company more money, giving LOOK ample headroom to grow its debt facilities.
Next Steps:
LOOK’s debt level is appropriate for a company its size, and it is also able to generate sufficient cash flow coverage, meaning it has been able to put its debt in good use. In addition to this, the company exhibits an ability to meet its near term obligations should an adverse event occur. This is only a rough assessment of financial health, and I’m sure LOOK has company-specific issues impacting its capital structure decisions. You should continue to research Lookers to get a more holistic view of the stock by looking at:
Future Outlook: What are well-informed industry analysts predicting for LOOK’s future growth? Take a look at our free research report of analyst consensus for LOOK’s outlook.
Valuation: What is LOOK worth today? Is the stock undervalued, even when its growth outlook is factored into its intrinsic value? The intrinsic value infographic in our free research report helps visualize whether LOOK is currently mispriced by the market.
Other High-Performing Stocks: Are there other stocks that provide better prospects with proven track records? Explore our free list of these great stocks here.
To help readers see past the short term volatility of the financial market, we aim to bring you a long-term focused research analysis purely driven by fundamental data. Note that our analysis does not factor in the latest price-sensitive company announcements.
The author is an independent contributor and at the time of publication had no position in the stocks mentioned. For errors that warrant correction please contact the editor at editorial-team@simplywallst.com.
