
 Yahoo Finance
 How Financially Strong Is Eastman Chemical Company (NYSE:EMN)?

Want to participate in a short research study? Help shape the future of investing tools and you could win a $250 gift card!
Eastman Chemical Company (NYSE:EMN), a large-cap worth US$11b, comes to mind for investors seeking a strong and reliable stock investment. Big corporations are much sought after by risk-averse investors who find diversified revenue streams and strong capital returns attractive. However, its financial health remains the key to continued success. Let’s take a look at Eastman Chemical’s leverage and assess its financial strength to get an idea of their ability to fund strategic acquisitions and grow through cyclical pressures. Remember this is a very top-level look that focuses exclusively on financial health, so I recommend a deeper analysis into EMN here.
See our latest analysis for Eastman Chemical
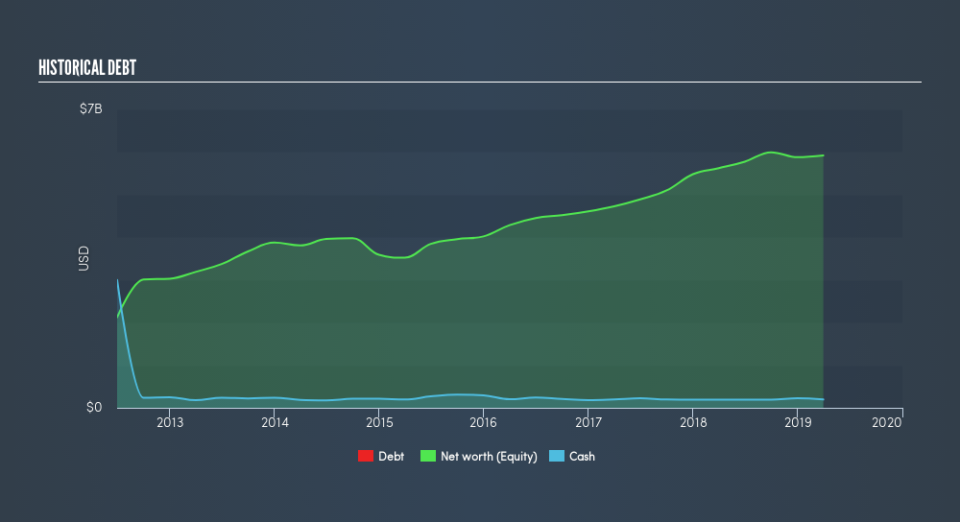
Does EMN Produce Much Cash Relative To Its Debt?
EMN's debt level has been constant at around US$6.7b over the previous year – this includes long-term debt. At this stable level of debt, the current cash and short-term investment levels stands at US$195m to keep the business going. Additionally, EMN has produced US$1.6b in operating cash flow over the same time period, resulting in an operating cash to total debt ratio of 24%, meaning that EMN’s operating cash is sufficient to cover its debt.
Can EMN meet its short-term obligations with the cash in hand?
With current liabilities at US$2.4b, it seems that the business has been able to meet these obligations given the level of current assets of US$3.6b, with a current ratio of 1.51x. The current ratio is calculated by dividing current assets by current liabilities. For Chemicals companies, this ratio is within a sensible range as there's enough of a cash buffer without holding too much capital in low return investments.
Does EMN face the risk of succumbing to its debt-load?
With total debt exceeding equities, Eastman Chemical is considered a highly levered company. This isn’t uncommon for large companies because interest payments on debt are tax deductible, meaning debt can be a cheaper source of capital than equity. Since large-caps are seen as safer than their smaller constituents, they tend to enjoy lower cost of capital. By measuring how many times EMN’s earnings can cover interest payments, we can evaluate whether its level of debt is sustainable or not. Net interest should be covered by earnings before interest and tax (EBIT) by at least three times to be safe. In EMN's case, the ratio of 6.16x suggests that interest is appropriately covered. Large-cap investments like EMN are often believed to be a safe investment due to their ability to pump out ample earnings multiple times its interest payments.
Next Steps:
EMN’s debt and cash flow levels indicate room for improvement. Its cash flow coverage of less than a quarter of debt means that operating efficiency could be an issue. Though, the company exhibits an ability to meet its near-term obligations, which isn't a big surprise for a large-cap. Keep in mind I haven't considered other factors such as how EMN has been performing in the past. I recommend you continue to research Eastman Chemical to get a more holistic view of the stock by looking at:
Future Outlook: What are well-informed industry analysts predicting for EMN’s future growth? Take a look at our free research report of analyst consensus for EMN’s outlook.
Valuation: What is EMN worth today? Is the stock undervalued, even when its growth outlook is factored into its intrinsic value? The intrinsic value infographic in our free research report helps visualize whether EMN is currently mispriced by the market.
Other High-Performing Stocks: Are there other stocks that provide better prospects with proven track records? Explore our free list of these great stocks here.
We aim to bring you long-term focused research analysis driven by fundamental data. Note that our analysis may not factor in the latest price-sensitive company announcements or qualitative material.
If you spot an error that warrants correction, please contact the editor at editorial-team@simplywallst.com. This article by Simply Wall St is general in nature. It does not constitute a recommendation to buy or sell any stock, and does not take account of your objectives, or your financial situation. Simply Wall St has no position in the stocks mentioned. Thank you for reading.
