
 Yahoo Finance
 How Financially Strong Is ATW Tech Inc. (CVE:ATW)?

Want to participate in a short research study? Help shape the future of investing tools and you could win a $250 gift card!
ATW Tech Inc. (CVE:ATW) is a small-cap stock with a market capitalization of CA$3.6m. While investors primarily focus on the growth potential and competitive landscape of the small-cap companies, they end up ignoring a key aspect, which could be the biggest threat to its existence: its financial health. Why is it important? Given that ATW is not presently profitable, it’s vital to understand the current state of its operations and pathway to profitability. The following basic checks can help you get a picture of the company's balance sheet strength. Nevertheless, these checks don't give you a full picture, so I recommend you dig deeper yourself into ATW here.
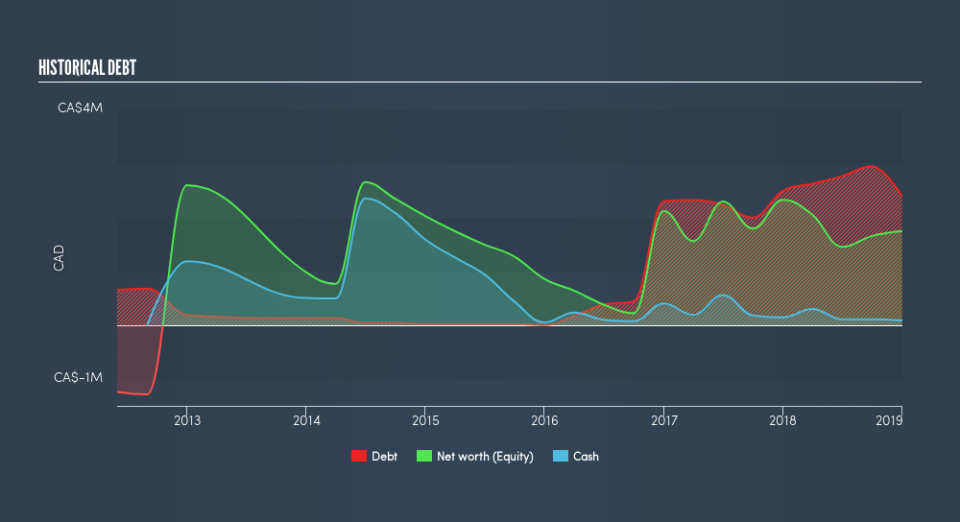
ATW’s Debt (And Cash Flows)
Over the past year, ATW has maintained its debt levels at around CA$2.4m including long-term debt. At this current level of debt, the current cash and short-term investment levels stands at CA$89k , ready to be used for running the business. Its negative operating cash flow means calculating cash-to-debt wouldn't be useful. For this article’s sake, I won’t be looking at this today, but you can take a look at some of ATW’s operating efficiency ratios such as ROA here.
Can ATW pay its short-term liabilities?
With current liabilities at CA$2.5m, it seems that the business may not have an easy time meeting these commitments with a current assets level of CA$2.0m, leading to a current ratio of 0.78x. The current ratio is the number you get when you divide current assets by current liabilities.
Does ATW face the risk of succumbing to its debt-load?
With total debt exceeding equity, ATW is considered a highly levered company. This is a bit unusual for a small-cap stock, since they generally have a harder time borrowing than large more established companies. But since ATW is currently loss-making, sustainability of its current state of operations becomes a concern. Running high debt, while not yet making money, can be risky in unexpected downturns as liquidity may dry up, making it hard to operate.
Next Steps:
Although ATW’s debt level is towards the higher end of the spectrum, its cash flow coverage seems adequate to meet debt obligations which means its debt is being efficiently utilised. Though its low liquidity raises concerns over whether current asset management practices are properly implemented for the small-cap. Keep in mind I haven't considered other factors such as how ATW has been performing in the past. I suggest you continue to research ATW Tech to get a better picture of the stock by looking at:
Historical Performance: What has ATW's returns been like over the past? Go into more detail in the past track record analysis and take a look at the free visual representations of our analysis for more clarity.
Other High-Performing Stocks: Are there other stocks that provide better prospects with proven track records? Explore our free list of these great stocks here.
We aim to bring you long-term focused research analysis driven by fundamental data. Note that our analysis may not factor in the latest price-sensitive company announcements or qualitative material.
If you spot an error that warrants correction, please contact the editor at editorial-team@simplywallst.com. This article by Simply Wall St is general in nature. It does not constitute a recommendation to buy or sell any stock, and does not take account of your objectives, or your financial situation. Simply Wall St has no position in the stocks mentioned. Thank you for reading.
