
 Yahoo Finance
 Fidelity National (FIS) Q1 Earnings Top on Lower Expenses
Fidelity National Information Services, Inc. FIS reported first-quarter 2023 adjusted earnings per share (EPS) of $1.29, which outpaced the Zacks Consensus Estimate by 7.5% and our estimate of $1.17. However, the bottom line declined 12.2% year over year.
Revenues inched up 1% year over year to $3,510 million. The top line beat the consensus mark by 3.1% and our estimate of $3,381.8 million. The organic revenue growth came in at 3% in the quarter under review.
The quarterly results benefited on the back of well-performing Banking and Capital Markets businesses. FIS’s Future Forward enterprise transaction program reaped results in the form of cash savings this quarter. A diversified client base and recurring revenue growth should support growth in the future.
Fidelity National Information Services, Inc. Price, Consensus and EPS Surprise
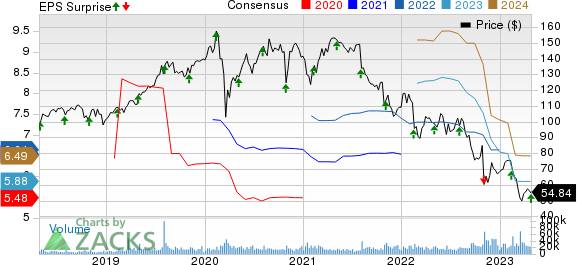
Fidelity National Information Services, Inc. price-consensus-eps-surprise-chart | Fidelity National Information Services, Inc. Quote
Q1 Performance
The cost of revenues of $2,169 million slipped 3.3% year over year. Selling, general and administrative expenses also declined 3% year over year to $1,004 million in the first quarter.
Adjusted earnings before interest, tax, depreciation and amortization (EBITDA) of Fidelity National fell 4% year over year to $1,359 million. The adjusted EBITDA margin of 38.7% deteriorated 190 basis points (bps) year over year.
On a GAAP basis, FIS reported net earnings attributable to common shareholders of $140 million or a gain of 24 cents per share. Notably, earnings of $120 million or 20 cents per share were reported in the prior-year quarter.
Segmental Performance
Revenues from Banking Solutions improved 2% year over year to $1,685 million in the first quarter, beating the Zacks Consensus Estimate by 4.1% and our estimate of $1,607.7. The organic revenue growth was 2%. Adjusted EBITDA margin of 40.7% deteriorated 250 bps year over year due to the lower-margin revenue mix.
Merchant Solutions’ revenues were recorded at $1,105 million, which dipped 1% year over year. However, it beat the consensus mark by 3% and our estimate of $1,055.5 million. The organic revenue growth came in at 2%. Adjusted EBITDA margin deteriorated 350 bps year over year to 43.5% due to the lower-margin revenue mix.
Revenues from Capital Market Solutions increased 6% year over year to $663 million in the quarter under review. However, the metric missed the consensus mark by 2.3% and our estimate of $684.2 million. The organic revenue growth was reported at 7%. Adjusted EBITDA margin of 48.2% improved 30 bps year over year on the back of strong contribution margins from revenue growth.
The Corporate and Other segment’s revenues of $57 million plunged 39% year over year but beat the consensus mark of $34.78 million.
Balance Sheet & Cash Flow
Fidelity National exited the first quarter with cash and cash equivalents of $1,871 million, which fell from $2,188 million at 2022-end. Total assets of $61,078 million dropped from $63,278 million at 2022-end.
Long-term debt, excluding the current portion, came in at $13,905 million at the first-quarter end. The figure tumbled from $14,207 million as of Dec 31, 2022. The current portion of long-term debt was $2,139 million, while short-term borrowings were $3,968 million.
Total stockholders’ equity of $27,097 million declined 0.4% from the 2022-end level.
In the first quarter of 2023, net cash provided by operations fell 29.5% from the figure in the prior-year quarter to $632 million. FIS generated a free cash flow of $641 million in the first quarter, which decreased 18.4% year over year.
Capital Deployment
Fidelity National rewarded $309 million to its shareholders via dividends in the quarter under review.
Divestiture of Merchant Solutions Business Announced
FIS’s tax-free spin-off of its Merchant Solutions business is likely to be closed by early 2024.
Update on Enterprise Transformation Program
FIS achieved annualized Future Forward cash savings of $210 million as of Mar 31, 2023. The company reinforced its earlier guidance for cash savings of $1.25 billion by 2024-end.
2Q23 View
Revenues are forecasted to remain between $3,675 million and $3,725 million, while adjusted EPS is estimated to be in the $1.45-$1.50 band.
2023 Guidance
Management revised the guidance for net revenues upward, which is expected to lie between $14,285 million and $14,535 million, the mid-point of which indicates a 0.8% decline from the 2022 reported figure of $14,528 million.
Adjusted EPS is forecasted within $5.76-$6.06 for 2023, the mid-point of which suggests an 11.1% fall from the 2022 figure of $6.65.
Zacks Rank
Fidelity National currently has a Zacks Rank #2 (Buy). You can see the complete list of today’s Zacks #1 Rank (Strong Buy) stocks here.
Performance of Other Financial Transaction Services Players
Fiserv, Inc. FISV reported impressive first-quarter 2023 results, wherein earnings and revenues beat the Zacks Consensus Estimate.
Adjusted earnings per share (excluding 69 cents from non-recurring items) of $1.58 increased 12.9% year over year, beating the consensus mark by 1.3%. Earnings beat our estimate by 2.6%. Adjusted revenues of $4.28 billion beat the Zacks Consensus Estimate by 3% and increased 9.5% year over year. Revenues surpassed our estimates by 4.7%.
Omnicom Group Inc. OMC reported better-than-expected first-quarter 2023 results. OMC’s earnings of $1.56 per share beat the Zacks Consensus Estimate by 13% and our estimates by 11.4%. EPS increased 12.2% year over year. Total revenues of $3.4 billion surpassed the consensus estimate by 2.3% and our estimate by 1.4%. The top line increased 1% year over year.
Equifax Inc. EFX reported better-than-expected first-quarter 2023 results. Adjusted earnings (excluding 52 cents from non-recurring items) came in at $1.43, beating the consensus mark by 4.4% but declining 35.6% from the year-ago figure.
Total revenues of $1.3 billion surpassed the consensus estimate by 1.5% but decreased 4.5% on a reported basis from the year-ago figure. The top line was down 3% on a local currency basis.
Want the latest recommendations from Zacks Investment Research? Today, you can download 7 Best Stocks for the Next 30 Days. Click to get this free report
Omnicom Group Inc. (OMC) : Free Stock Analysis Report
Fidelity National Information Services, Inc. (FIS) : Free Stock Analysis Report
Fiserv, Inc. (FISV) : Free Stock Analysis Report
Equifax, Inc. (EFX) : Free Stock Analysis Report
