
 Yahoo Finance
 Fancamp Exploration Ltd. (CVE:FNC): What Does Its Beta Value Mean For Your Portfolio?

If you're interested in Fancamp Exploration Ltd. (CVE:FNC), then you might want to consider its beta (a measure of share price volatility) in order to understand how the stock could impact your portfolio. Modern finance theory considers volatility to be a measure of risk, and there are two main types of price volatility. First, we have company specific volatility, which is the price gyrations of an individual stock. Holding at least 8 stocks can reduce this kind of risk across a portfolio. The second sort is caused by the natural volatility of markets, overall. For example, certain macroeconomic events will impact (virtually) all stocks on the market.
Some stocks mimic the volatility of the market quite closely, while others demonstrate muted, exagerrated or uncorrelated price movements. Some investors use beta as a measure of how much a certain stock is impacted by market risk (volatility). While we should keep in mind that Warren Buffett has cautioned that 'Volatility is far from synonymous with risk', beta is still a useful factor to consider. To make good use of it you must first know that the beta of the overall market is one. A stock with a beta below one is either less volatile than the market, or more volatile but not corellated with the overall market. In comparison a stock with a beta of over one tends to be move in a similar direction to the market in the long term, but with greater changes in price.
View our latest analysis for Fancamp Exploration
What FNC's beta value tells investors
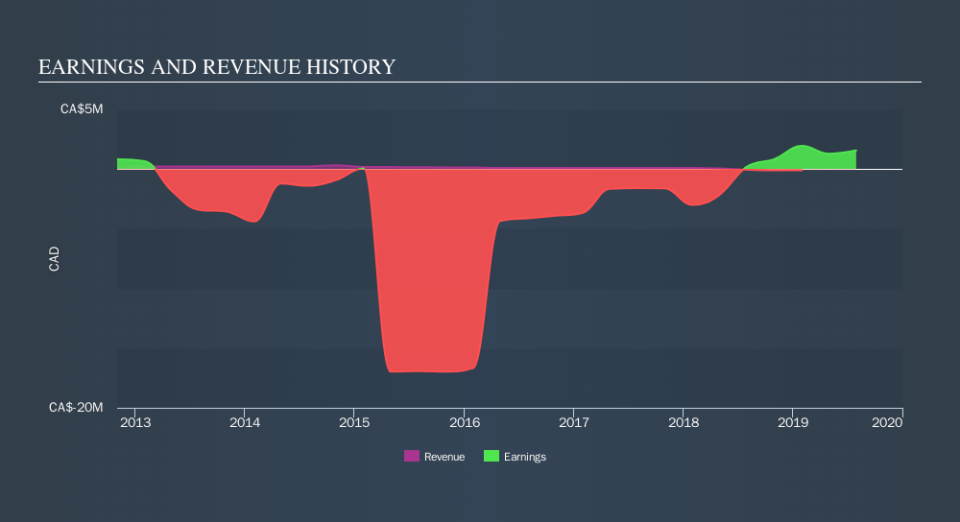
Given that it has a beta of 1.84, we can surmise that the Fancamp Exploration share price has been fairly sensitive to market volatility (over the last 5 years). Based on this history, investors should be aware that Fancamp Exploration are likely to rise strongly in times of greed, but sell off in times of fear. Beta is worth considering, but it's also important to consider whether Fancamp Exploration is growing earnings and revenue. You can take a look for yourself, below.
How does FNC's size impact its beta?
Fancamp Exploration is a rather small company. It has a market capitalisation of CA$9.2m, which means it is probably under the radar of most investors. It takes less money to influence the share price of a very small company. This may explain the excess volatility implied by this beta value.
What this means for you:
Since Fancamp Exploration has a reasonably high beta, it's worth considering why it is so heavily influenced by broader market sentiment. For example, it might be a high growth stock or have a lot of operating leverage in its business model. In order to fully understand whether FNC is a good investment for you, we also need to consider important company-specific fundamentals such as Fancamp Exploration’s financial health and performance track record. I highly recommend you dive deeper by considering the following:
Valuation: What is FNC worth today? Is the stock undervalued, even when its growth outlook is factored into its intrinsic value? The intrinsic value infographic in our free research report helps visualize whether FNC is currently mispriced by the market.
Past Track Record: Has FNC been consistently performing well irrespective of the ups and downs in the market? Go into more detail in the past performance analysis and take a look at the free visual representations of FNC's historicals for more clarity.
Other High-Performing Stocks: Are there other stocks that provide better prospects with proven track records? Explore our free list of these great stocks here.
We aim to bring you long-term focused research analysis driven by fundamental data. Note that our analysis may not factor in the latest price-sensitive company announcements or qualitative material.
If you spot an error that warrants correction, please contact the editor at editorial-team@simplywallst.com. This article by Simply Wall St is general in nature. It does not constitute a recommendation to buy or sell any stock, and does not take account of your objectives, or your financial situation. Simply Wall St has no position in the stocks mentioned. Thank you for reading.
