
 Yahoo Finance
 Fairfax Financial Holdings Limited's (TSE:FFH) Financials Are Too Obscure To Link With Current Share Price Momentum: What's In Store For the Stock?
Fairfax Financial Holdings' (TSE:FFH) stock is up by 7.0% over the past three months. However, we decided to study the company's mixed-bag of fundamentals to assess what this could mean for future share prices, as stock prices tend to be aligned with a company's long-term financial performance. Particularly, we will be paying attention to Fairfax Financial Holdings' ROE today.
Return on equity or ROE is an important factor to be considered by a shareholder because it tells them how effectively their capital is being reinvested. Put another way, it reveals the company's success at turning shareholder investments into profits.
Check out our latest analysis for Fairfax Financial Holdings
How To Calculate Return On Equity?
Return on equity can be calculated by using the formula:
Return on Equity = Net Profit (from continuing operations) ÷ Shareholders' Equity
So, based on the above formula, the ROE for Fairfax Financial Holdings is:
6.3% = US$1.3b ÷ US$20b (Based on the trailing twelve months to December 2022).
The 'return' is the income the business earned over the last year. Another way to think of that is that for every CA$1 worth of equity, the company was able to earn CA$0.06 in profit.
What Has ROE Got To Do With Earnings Growth?
So far, we've learned that ROE is a measure of a company's profitability. Depending on how much of these profits the company reinvests or "retains", and how effectively it does so, we are then able to assess a company’s earnings growth potential. Assuming all else is equal, companies that have both a higher return on equity and higher profit retention are usually the ones that have a higher growth rate when compared to companies that don't have the same features.
Fairfax Financial Holdings' Earnings Growth And 6.3% ROE
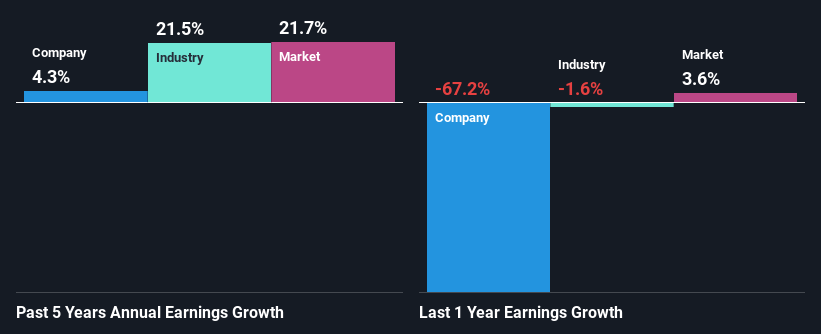
At first glance, Fairfax Financial Holdings' ROE doesn't look very promising. Next, when compared to the average industry ROE of 11%, the company's ROE leaves us feeling even less enthusiastic. As a result, Fairfax Financial Holdings reported a very low income growth of 4.3% over the past five years.
As a next step, we compared Fairfax Financial Holdings' net income growth with the industry and were disappointed to see that the company's growth is lower than the industry average growth of 21% in the same period.
Earnings growth is an important metric to consider when valuing a stock. It’s important for an investor to know whether the market has priced in the company's expected earnings growth (or decline). Doing so will help them establish if the stock's future looks promising or ominous. If you're wondering about Fairfax Financial Holdings''s valuation, check out this gauge of its price-to-earnings ratio, as compared to its industry.
Is Fairfax Financial Holdings Using Its Retained Earnings Effectively?
A low three-year median payout ratio of 9.5% (implying that the company retains the remaining 91% of its income) suggests that Fairfax Financial Holdings is retaining most of its profits. However, the low earnings growth number doesn't reflect this as high growth usually follows high profit retention. So there could be some other explanation in that regard. For instance, the company's business may be deteriorating.
Additionally, Fairfax Financial Holdings has paid dividends over a period of at least ten years, which means that the company's management is determined to pay dividends even if it means little to no earnings growth.
Conclusion
Overall, we have mixed feelings about Fairfax Financial Holdings. Even though it appears to be retaining most of its profits, given the low ROE, investors may not be benefitting from all that reinvestment after all. The low earnings growth suggests our theory correct. That being so, according to the latest industry analyst forecasts, the company's earnings are expected to shrink in the future. To know more about the latest analysts predictions for the company, check out this visualization of analyst forecasts for the company.
Have feedback on this article? Concerned about the content? Get in touch with us directly. Alternatively, email editorial-team (at) simplywallst.com.
This article by Simply Wall St is general in nature. We provide commentary based on historical data and analyst forecasts only using an unbiased methodology and our articles are not intended to be financial advice. It does not constitute a recommendation to buy or sell any stock, and does not take account of your objectives, or your financial situation. We aim to bring you long-term focused analysis driven by fundamental data. Note that our analysis may not factor in the latest price-sensitive company announcements or qualitative material. Simply Wall St has no position in any stocks mentioned.
Join A Paid User Research Session
You’ll receive a US$30 Amazon Gift card for 1 hour of your time while helping us build better investing tools for the individual investors like yourself. Sign up here
