Facebook (FB) Q3 Earnings Beat, Revenues Up on User Growth
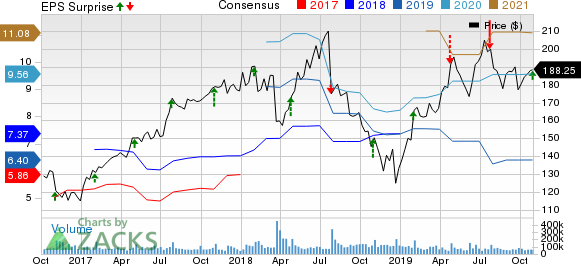
Facebook FB reported third-quarter 2019 earnings of $2.12 per share that beat the Zacks Consensus Estimate by a whopping 21 cents. The figure increased 20.2% year over year.
Revenues of $16.89 billion comfortably surpassed the Zacks Consensus Estimate of $16.45 billion and rose 28.6% year over year. At constant currency (cc), revenues rallied 30.8%.
Asia-Pacific: The Fastest Growing Market
Monthly active users (MAUs) were 2.449 billion, up 7.8% year over year. Daily Active Users (DAUs) were 1.623 billion on average, increasing 8.6% year over year and representing 66% of MAUs.
Asia-Pacific was Facebook’s fastest-growing market in the quarter, driven by growth in India, Indonesia and the Philippines.
Asia-Pacific DAUs increased 11.8% year over year to 627 million. DAUs in Rest of the World (RoW), Europe and the United States & Canada increased 10.4%, 3.6% and 2.2% to 519 million, 288 million and 189 million, respectively.
MAUs in Asia-Pacific, RoW, Europe and the United States & Canada grew 10.5%, 9%, 3.2% and 2.1% to 1.01 billion, 802 million, 387 million and 247 million, respectively.
The company stated that more than 2.2 billion people now use its “Family” of services, which includes Facebook, WhatsApp, Instagram and Messenger, every day on average. Moreover, almost 2.8 billion people use at least one of its services on a monthly basis.

Additionally, Facebook estimates that more than 140 million businesses, mostly small businesses, are using its services on a monthly basis.
Revenue Details
Geographically, Asia-Pacific was the strongest region, with revenue growth of 34.9% year over year, followed by RoW’s 33.9%, the United States & Canada’s 27.3%, and Europe’s 24.5%.
Advertising revenues rose 28.4% year over year (32% at cc) to $17.38 billion. Asia-Pacific and RoW were the strongest regions, increasing 34.8% and 33.8%, respectively. Advertising revenues in the United States & Canada and Europe grew 27% and 24.2%, respectively.
Mobile ad revenues were $16.4 billion, contributing 94% to total ad revenues. Ad impressions served increased 37%, driven by ads on Instagram Stories and Feed, and Facebook News Feed.
However, average price per ad decreased 6% from the year-ago quarter due to an unfavorable mix shift toward Stories ads and geographies like Asia-Pacific, where the monetization rate is low.
Average Revenue per User (ARPU) growth was strongest in the United States & Canada, increasing 25.1% year over year, followed by RoW’s 23.1%. ARPU in Asia-Pacific and Europe grew 21.3% and 21.1%, respectively. Worldwide ARPU increased 19.2% to $7.26.
Payments and other fees jumped 43.1% year over year to $269 million. The growth was primarily driven by sales of new products, particularly Oculus Quest.
Operating Details
In the reported quarter, costs and expenses soared 31.7% year over year to $10.47 billion.
Marketing & sales expenses grew 25.3% from the year-ago quarter to $2.42 billion. General & administrative expenses surged 42.9% year over year to $1.35 billion. Also, research & development expenses rose 33.5% to $3.55 billion.
Notably, Facebook’s employee base expanded 28% year over year to 43K.
Operating income of $7.19 billion increased 24.3% year over year.
Balance Sheet & Cash Flow
As of Sep 30, 2019, cash & cash equivalents and marketable securities were $52.27 billion compared with $48.60 billion as of Jun 30, 2019.
Capital expenditures were $3.68 billion, driven by ongoing investments in data centers, servers, network infrastructure and office facilities.
Free cash flow was $5.63 billion compared with $4.84 billion in the previous quarter.
Facebook bought back shares worth almost $1.2 billion in the reported quarter.
Guidance
Facebook expects the fourth-quarter revenue growth rate to decline mid-to-high-single digit percentage on a sequential basis, primarily due to ad targeting related headwinds.
Moreover, 2019 total expenses are now expected between $46 billion and $48 billion. The range includes $5 billion in accruals that the company recorded in the first half of 2019 related to FTC settlement.
Capital expenditures are now expected to be $16 billion, matching the lower end of the previous guidance of $16-$18 billion.
For 2020, total expenses are expected between $54 billion and $59 billion. Capital expenditures are expected to be $17-$19 billion, due to investments in data centers, servers, office facilities and network infrastructure.
Zacks Rank & Key Picks
Facebook currently carries a Zacks Rank #3 (Hold).
Itron ITRI, Digital Turbine APPS and Dropbox DBX are some better-ranked stocks in the broader computer and technology sector. While Itron sports a Zacks Rank #1 (Strong Buy), Digital Turbine and Dropbox carry a Zacks Rank #2 (Buy). You can see the complete list of today’s Zacks #1 Rank stocks here.
While both Itron and Digital Turbine are set to report quarterly results on Nov 4, Dropbox is scheduled to report on Nov 7.
Free: Zacks’ Single Best Stock Set to Double
Today you are invited to download our just-released Special Report that reveals 5 stocks with the most potential to gain +100% or more in 2020. From those 5, Zacks Director of Research, Sheraz Mian hand-picks one to have the most explosive upside of all.
This pioneering tech ticker had soared to all-time highs and then subsided to a price that is irresistible. Now a pending acquisition could super-charge the company’s drive past competitors in the development of true Artificial Intelligence. The earlier you get in to this stock, the greater your potential gain.
Download Free Report Now >>
Click to get this free report Facebook, Inc. (FB) : Free Stock Analysis Report Digital Turbine, Inc. (APPS) : Free Stock Analysis Report Itron, Inc. (ITRI) : Free Stock Analysis Report Dropbox, Inc. (DBX) : Free Stock Analysis Report To read this article on Zacks.com click here. Zacks Investment Research

 Yahoo Finance