
 Yahoo Finance
 Should You Be Excited About Urban One, Inc.'s (NASDAQ:UONE.K) 23% Return On Equity?
One of the best investments we can make is in our own knowledge and skill set. With that in mind, this article will work through how we can use Return On Equity (ROE) to better understand a business. We'll use ROE to examine Urban One, Inc. (NASDAQ:UONE.K), by way of a worked example.
ROE or return on equity is a useful tool to assess how effectively a company can generate returns on the investment it received from its shareholders. In other words, it is a profitability ratio which measures the rate of return on the capital provided by the company's shareholders.
Check out our latest analysis for Urban One
How To Calculate Return On Equity?
The formula for return on equity is:
Return on Equity = Net Profit (from continuing operations) ÷ Shareholders' Equity
So, based on the above formula, the ROE for Urban One is:
23% = US$61m ÷ US$265m (Based on the trailing twelve months to September 2021).
The 'return' refers to a company's earnings over the last year. So, this means that for every $1 of its shareholder's investments, the company generates a profit of $0.23.
Does Urban One Have A Good Return On Equity?
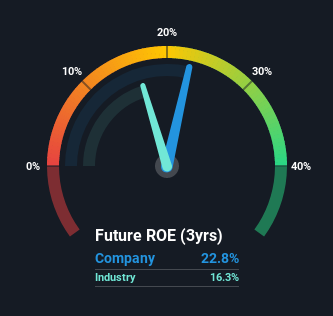
Arguably the easiest way to assess company's ROE is to compare it with the average in its industry. The limitation of this approach is that some companies are quite different from others, even within the same industry classification. As is clear from the image below, Urban One has a better ROE than the average (16%) in the Media industry.
That's what we like to see. Bear in mind, a high ROE doesn't always mean superior financial performance. Especially when a firm uses high levels of debt to finance its debt which may boost its ROE but the high leverage puts the company at risk. Our risks dashboardshould have the 3 risks we have identified for Urban One.
Why You Should Consider Debt When Looking At ROE
Companies usually need to invest money to grow their profits. That cash can come from issuing shares, retained earnings, or debt. In the first two cases, the ROE will capture this use of capital to grow. In the latter case, the debt used for growth will improve returns, but won't affect the total equity. Thus the use of debt can improve ROE, albeit along with extra risk in the case of stormy weather, metaphorically speaking.
Combining Urban One's Debt And Its 23% Return On Equity
It appears that Urban One makes extensive use of debt to improve its returns, because it has an alarmingly high debt to equity ratio of 3.09. While its ROE is no doubt quite impressive, it could give a false impression about the company's returns given that its huge debt could be boosting those returns.
Conclusion
Return on equity is a useful indicator of the ability of a business to generate profits and return them to shareholders. In our books, the highest quality companies have high return on equity, despite low debt. If two companies have the same ROE, then I would generally prefer the one with less debt.
Having said that, while ROE is a useful indicator of business quality, you'll have to look at a whole range of factors to determine the right price to buy a stock. Profit growth rates, versus the expectations reflected in the price of the stock, are a particularly important to consider. So I think it may be worth checking this free this detailed graph of past earnings, revenue and cash flow.
If you would prefer check out another company -- one with potentially superior financials -- then do not miss this free list of interesting companies, that have HIGH return on equity and low debt.
Have feedback on this article? Concerned about the content? Get in touch with us directly. Alternatively, email editorial-team (at) simplywallst.com.
This article by Simply Wall St is general in nature. We provide commentary based on historical data and analyst forecasts only using an unbiased methodology and our articles are not intended to be financial advice. It does not constitute a recommendation to buy or sell any stock, and does not take account of your objectives, or your financial situation. We aim to bring you long-term focused analysis driven by fundamental data. Note that our analysis may not factor in the latest price-sensitive company announcements or qualitative material. Simply Wall St has no position in any stocks mentioned.
