
 Yahoo Finance
 Should We Be Excited About The Trends Of Returns At LKQ (NASDAQ:LKQ)?
What trends should we look for it we want to identify stocks that can multiply in value over the long term? Firstly, we'll want to see a proven return on capital employed (ROCE) that is increasing, and secondly, an expanding base of capital employed. Put simply, these types of businesses are compounding machines, meaning they are continually reinvesting their earnings at ever-higher rates of return. However, after briefly looking over the numbers, we don't think LKQ (NASDAQ:LKQ) has the makings of a multi-bagger going forward, but let's have a look at why that may be.
Understanding Return On Capital Employed (ROCE)
If you haven't worked with ROCE before, it measures the 'return' (pre-tax profit) a company generates from capital employed in its business. The formula for this calculation on LKQ is:
Return on Capital Employed = Earnings Before Interest and Tax (EBIT) ÷ (Total Assets - Current Liabilities)
0.096 = US$984m ÷ (US$12b - US$1.9b) (Based on the trailing twelve months to September 2020).
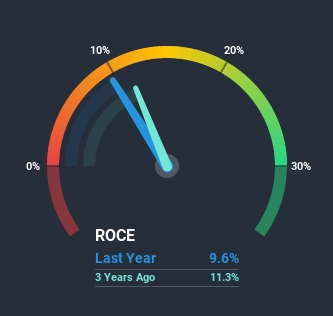
Therefore, LKQ has an ROCE of 9.6%. In absolute terms, that's a low return and it also under-performs the Retail Distributors industry average of 26%.
View our latest analysis for LKQ
In the above chart we have measured LKQ's prior ROCE against its prior performance, but the future is arguably more important. If you'd like, you can check out the forecasts from the analysts covering LKQ here for free.
What Can We Tell From LKQ's ROCE Trend?
In terms of LKQ's historical ROCE movements, the trend isn't fantastic. To be more specific, ROCE has fallen from 15% over the last five years. On the other hand, the company has been employing more capital without a corresponding improvement in sales in the last year, which could suggest these investments are longer term plays. It may take some time before the company starts to see any change in earnings from these investments.
What We Can Learn From LKQ's ROCE
Bringing it all together, while we're somewhat encouraged by LKQ's reinvestment in its own business, we're aware that returns are shrinking. Although the market must be expecting these trends to improve because the stock has gained 48% over the last five years. Ultimately, if the underlying trends persist, we wouldn't hold our breath on it being a multi-bagger going forward.
One more thing, we've spotted 3 warning signs facing LKQ that you might find interesting.
For those who like to invest in solid companies, check out this free list of companies with solid balance sheets and high returns on equity.
This article by Simply Wall St is general in nature. It does not constitute a recommendation to buy or sell any stock, and does not take account of your objectives, or your financial situation. We aim to bring you long-term focused analysis driven by fundamental data. Note that our analysis may not factor in the latest price-sensitive company announcements or qualitative material. Simply Wall St has no position in any stocks mentioned.
Have feedback on this article? Concerned about the content? Get in touch with us directly. Alternatively, email editorial-team (at) simplywallst.com.
