
 Yahoo Finance
 The exceet Group (ETR:EXC) Share Price Is Up 132% And Shareholders Are Boasting About It

The worst result, after buying shares in a company (assuming no leverage), would be if you lose all the money you put in. But in contrast you can make much more than 100% if the company does well. To wit, the exceet Group SE (ETR:EXC) share price has flown 132% in the last three years. How nice for those who held the stock!
Check out our latest analysis for exceet Group
While the efficient markets hypothesis continues to be taught by some, it has been proven that markets are over-reactive dynamic systems, and investors are not always rational. One way to examine how market sentiment has changed over time is to look at the interaction between a company's share price and its earnings per share (EPS).
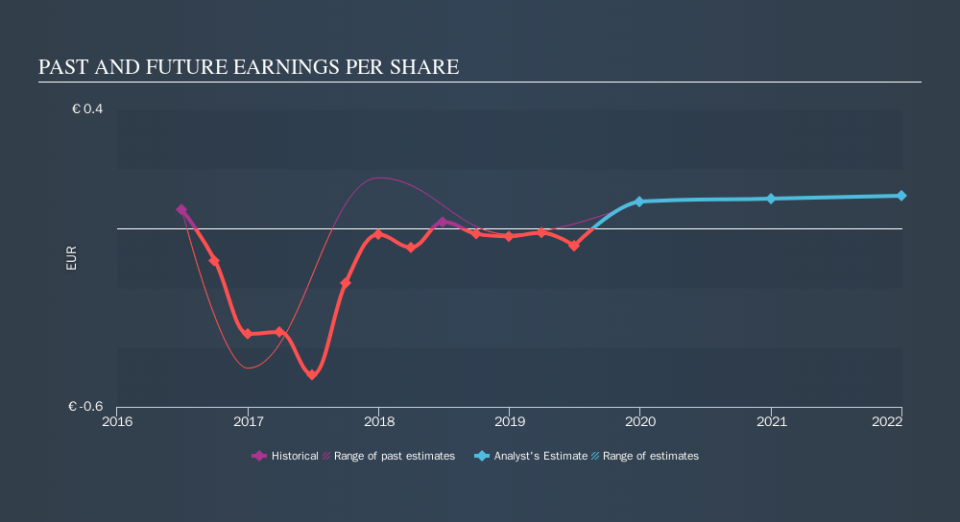
During three years of share price growth, exceet Group achieved compound earnings per share growth of 51% per year. This EPS growth is higher than the 32% average annual increase in the share price. Therefore, it seems the market has moderated its expectations for growth, somewhat.
The graphic below depicts how EPS has changed over time (unveil the exact values by clicking on the image).
We know that exceet Group has improved its bottom line over the last three years, but what does the future have in store? Take a more thorough look at exceet Group's financial health with this free report on its balance sheet.
A Different Perspective
It's nice to see that exceet Group shareholders have received a total shareholder return of 14% over the last year. Since the one-year TSR is better than the five-year TSR (the latter coming in at 4.0% per year), it would seem that the stock's performance has improved in recent times. Given the share price momentum remains strong, it might be worth taking a closer look at the stock, lest you miss an opportunity. You might want to assess this data-rich visualization of its earnings, revenue and cash flow.
But note: exceet Group may not be the best stock to buy. So take a peek at this free list of interesting companies with past earnings growth (and further growth forecast).
Please note, the market returns quoted in this article reflect the market weighted average returns of stocks that currently trade on DE exchanges.
We aim to bring you long-term focused research analysis driven by fundamental data. Note that our analysis may not factor in the latest price-sensitive company announcements or qualitative material.
If you spot an error that warrants correction, please contact the editor at editorial-team@simplywallst.com. This article by Simply Wall St is general in nature. It does not constitute a recommendation to buy or sell any stock, and does not take account of your objectives, or your financial situation. Simply Wall St has no position in the stocks mentioned. Thank you for reading.
