
 Yahoo Finance
 Examining Saturn Oil & Gas Inc.’s (CVE:SOIL) Weak Return On Capital Employed

Today we are going to look at Saturn Oil & Gas Inc. (CVE:SOIL) to see whether it might be an attractive investment prospect. Specifically, we're going to calculate its Return On Capital Employed (ROCE), in the hopes of getting some insight into the business.
First up, we'll look at what ROCE is and how we calculate it. Second, we'll look at its ROCE compared to similar companies. Then we'll determine how its current liabilities are affecting its ROCE.
Return On Capital Employed (ROCE): What is it?
ROCE measures the 'return' (pre-tax profit) a company generates from capital employed in its business. In general, businesses with a higher ROCE are usually better quality. Ultimately, it is a useful but imperfect metric. Renowned investment researcher Michael Mauboussin has suggested that a high ROCE can indicate that 'one dollar invested in the company generates value of more than one dollar'.
How Do You Calculate Return On Capital Employed?
Analysts use this formula to calculate return on capital employed:
Return on Capital Employed = Earnings Before Interest and Tax (EBIT) ÷ (Total Assets - Current Liabilities)
Or for Saturn Oil & Gas:
0.019 = CA$686k ÷ (CA$41m - CA$5.3m) (Based on the trailing twelve months to June 2019.)
Therefore, Saturn Oil & Gas has an ROCE of 1.9%.
See our latest analysis for Saturn Oil & Gas
Is Saturn Oil & Gas's ROCE Good?
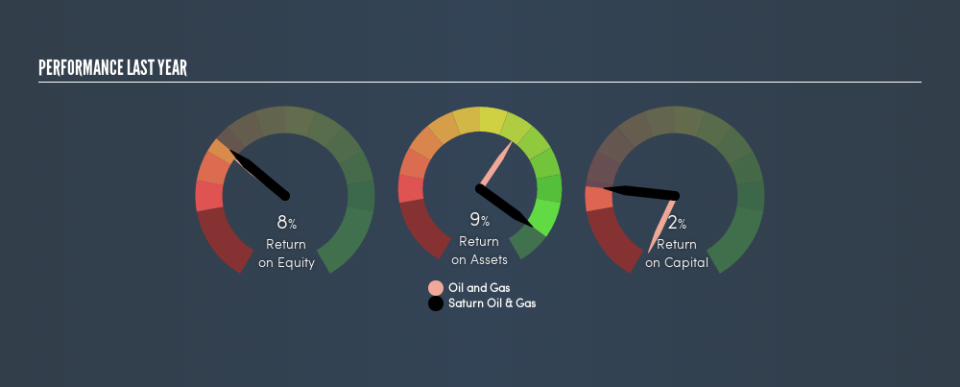
ROCE is commonly used for comparing the performance of similar businesses. We can see Saturn Oil & Gas's ROCE is meaningfully below the Oil and Gas industry average of 5.7%. This could be seen as a negative, as it suggests some competitors may be employing their capital more efficiently. Independently of how Saturn Oil & Gas compares to its industry, its ROCE in absolute terms is low; especially compared to the ~1.9% available in government bonds. It is likely that there are more attractive prospects out there.
Saturn Oil & Gas delivered an ROCE of 1.9%, which is better than 3 years ago, as was making losses back then. This makes us wonder if the company is improving. You can see in the image below how Saturn Oil & Gas's ROCE compares to its industry. Click to see more on past growth.
It is important to remember that ROCE shows past performance, and is not necessarily predictive. ROCE can be misleading for companies in cyclical industries, with returns looking impressive during the boom times, but very weak during the busts. This is because ROCE only looks at one year, instead of considering returns across a whole cycle. Remember that most companies like Saturn Oil & Gas are cyclical businesses. You can check if Saturn Oil & Gas has cyclical profits by looking at this free graph of past earnings, revenue and cash flow.
Saturn Oil & Gas's Current Liabilities And Their Impact On Its ROCE
Current liabilities include invoices, such as supplier payments, short-term debt, or a tax bill, that need to be paid within 12 months. Due to the way ROCE is calculated, a high level of current liabilities makes a company look as though it has less capital employed, and thus can (sometimes unfairly) boost the ROCE. To counteract this, we check if a company has high current liabilities, relative to its total assets.
Saturn Oil & Gas has total assets of CA$41m and current liabilities of CA$5.3m. Therefore its current liabilities are equivalent to approximately 13% of its total assets. With a very reasonable level of current liabilities, so the impact on ROCE is fairly minimal.
Our Take On Saturn Oil & Gas's ROCE
While that is good to see, Saturn Oil & Gas has a low ROCE and does not look attractive in this analysis. But note: make sure you look for a great company, not just the first idea you come across. So take a peek at this free list of interesting companies with strong recent earnings growth (and a P/E ratio below 20).
If you are like me, then you will not want to miss this free list of growing companies that insiders are buying.
We aim to bring you long-term focused research analysis driven by fundamental data. Note that our analysis may not factor in the latest price-sensitive company announcements or qualitative material.
If you spot an error that warrants correction, please contact the editor at editorial-team@simplywallst.com. This article by Simply Wall St is general in nature. It does not constitute a recommendation to buy or sell any stock, and does not take account of your objectives, or your financial situation. Simply Wall St has no position in the stocks mentioned. Thank you for reading.
