
 Yahoo Finance
 Euronet Worldwide (NASDAQ:EEFT) stock falls 5.3% in past week as three-year earnings and shareholder returns continue downward trend
For many investors, the main point of stock picking is to generate higher returns than the overall market. But in any portfolio, there are likely to be some stocks that fall short of that benchmark. Unfortunately, that's been the case for longer term Euronet Worldwide, Inc. (NASDAQ:EEFT) shareholders, since the share price is down 47% in the last three years, falling well short of the market return of around 31%. And over the last year the share price fell 39%, so we doubt many shareholders are delighted. The falls have accelerated recently, with the share price down 22% in the last three months.
After losing 5.3% this past week, it's worth investigating the company's fundamentals to see what we can infer from past performance.
Check out our latest analysis for Euronet Worldwide
While the efficient markets hypothesis continues to be taught by some, it has been proven that markets are over-reactive dynamic systems, and investors are not always rational. One flawed but reasonable way to assess how sentiment around a company has changed is to compare the earnings per share (EPS) with the share price.
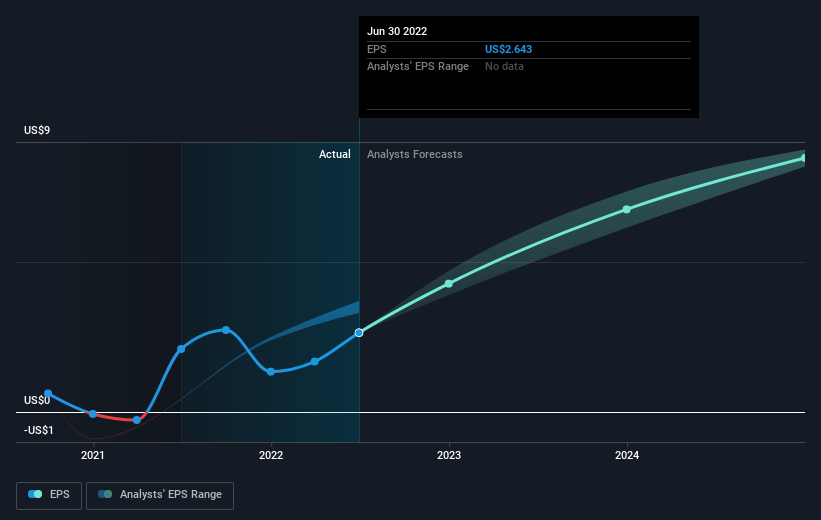
During the three years that the share price fell, Euronet Worldwide's earnings per share (EPS) dropped by 19% each year. So do you think it's a coincidence that the share price has dropped 19% per year, a very similar rate to the EPS? We don't. That suggests that the market sentiment around the company hasn't changed much over that time, despite the disappointment. Rather, the share price has approximately tracked EPS growth.
The image below shows how EPS has tracked over time (if you click on the image you can see greater detail).
We consider it positive that insiders have made significant purchases in the last year. Having said that, most people consider earnings and revenue growth trends to be a more meaningful guide to the business. Dive deeper into the earnings by checking this interactive graph of Euronet Worldwide's earnings, revenue and cash flow.
A Different Perspective
While the broader market lost about 20% in the twelve months, Euronet Worldwide shareholders did even worse, losing 39%. However, it could simply be that the share price has been impacted by broader market jitters. It might be worth keeping an eye on the fundamentals, in case there's a good opportunity. Unfortunately, last year's performance may indicate unresolved challenges, given that it was worse than the annualised loss of 4% over the last half decade. We realise that Baron Rothschild has said investors should "buy when there is blood on the streets", but we caution that investors should first be sure they are buying a high quality business. It is all well and good that insiders have been buying shares, but we suggest you check here to see what price insiders were buying at.
Euronet Worldwide is not the only stock that insiders are buying. For those who like to find winning investments this free list of growing companies with recent insider purchasing, could be just the ticket.
Please note, the market returns quoted in this article reflect the market weighted average returns of stocks that currently trade on US exchanges.
Have feedback on this article? Concerned about the content? Get in touch with us directly. Alternatively, email editorial-team (at) simplywallst.com.
This article by Simply Wall St is general in nature. We provide commentary based on historical data and analyst forecasts only using an unbiased methodology and our articles are not intended to be financial advice. It does not constitute a recommendation to buy or sell any stock, and does not take account of your objectives, or your financial situation. We aim to bring you long-term focused analysis driven by fundamental data. Note that our analysis may not factor in the latest price-sensitive company announcements or qualitative material. Simply Wall St has no position in any stocks mentioned.
Join A Paid User Research Session
You’ll receive a US$30 Amazon Gift card for 1 hour of your time while helping us build better investing tools for the individual investors like yourself. Sign up here
