
 Yahoo Finance
 EUR/USD Mid-Session Technical Analysis for February 22, 2018
The EUR/USD touched its lowest level since February 12 before tuning higher for the session on Thursday. U.S. Weekly Unemployment Claims hit 222K, coming in better-than-expected, so this may not have been the reason for the intraday short-covering rally. The move is taking place despite indications the Fed may raise interest rates as many as three times in 2018.
Daily Swing Chart Technical Analysis
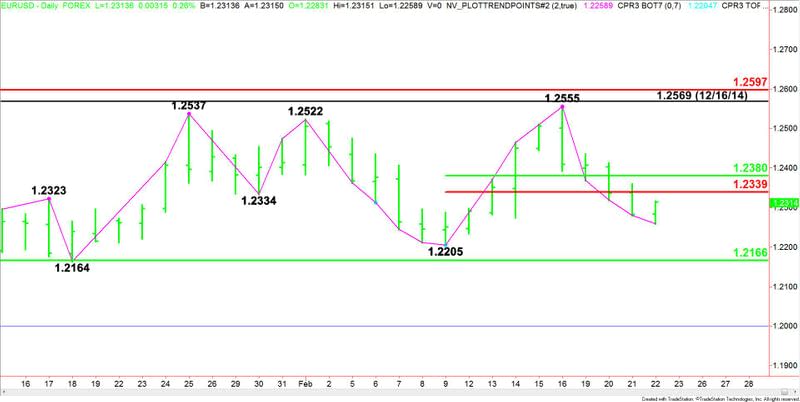
The main trend is up according to the daily swing chart. However, momentum has been trending lower since the formation of a closing price reversal top on February 16.
A trade through 1.2205 will change the main trend to down. A move through 1.2555 will negate the reversal top and signal a resumption of the uptrend. This could lead to a test of the December 16, 2014 main top at 1.2569 and the major Fibonacci level at 1.2597.
The short-term range is 1.2205 to 1.2555. Its retracement zone is 1.2380 to 1.2339. The market is currently trading on the weak side of this zone, helping to give it a downside bias. This zone will control the direction of the market as long as the EUR/USD holds above 1.2205.
If the trend changes to down then look for a move into the major 50% level at 1.2166, followed closely by the main bottom at 1.2164.
Daily Swing Chart Technical Analysis
Based on the early price action, a trade through 1.2259 will signal the presence of sellers. This could trigger an acceleration into 1.2205, 1.2166 then 1.2164.
Overcoming and sustaining a move over the Fib level at 1.2339 will indicate the presence of buyers. This could lead to a test of the 50% level at 1.2380. Overtaking this level will indicate the presence of buyers. This could lead to an acceleration to the upside.
This article was originally posted on FX Empire
