
 Yahoo Finance
 EUR/USD Mid-Session Technical Analysis for October 13, 2017
The EUR/USD is trading higher on Friday after U.S. consumer inflation failed to meet expectations, casting some doubts on the Fed’s ability to raise interest rates in December. Investors are also becoming more confident about the Euro Zone economy.
Daily Technical Analysis
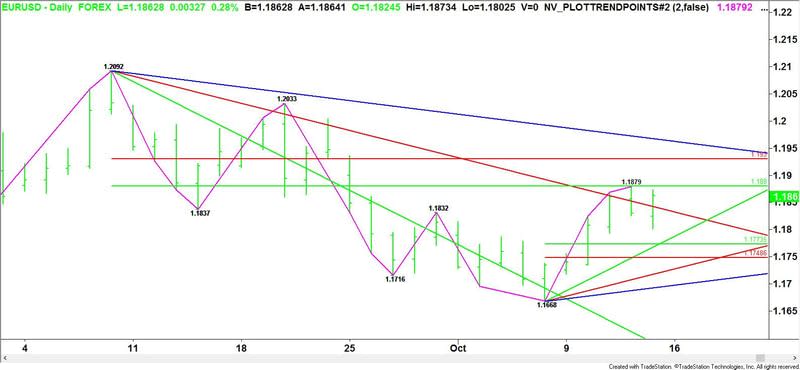
The main trend is up according to the daily swing chart. A trade through 1.1879 will negate yesterday’s closing price reversal top and signal a resumption of the uptrend.
The first upside target is the retracement zone at 1.1880 to 1.1930. This zone is controlling the longer-term direction of the EUR/USD.
Daily Forecast
Based on the current price action, the upside momentum should carry the EUR/USD into the main 50% level at 1.1880. We could see a technical bounce on the first test of this level; however, it is also the trigger point for an acceleration into the Fibonacci level at 1.1930. This is followed by a long-term downtrending angle at 1.1967.
The inability to overcome 1.1880 will indicate the presence of sellers. If volume builds on this move then look for the selling to extend into the long-term downtrending angle at 1.1842.
Crossing to the weak side of the angle at 1.1842 will indicate the selling is getting stronger. If the selling pressure intensifies then look for the selling to extend into at least the 50% level at 1.1773.
Basically, the upside momentum is strong and there is news supporting the rally. If the upside momentum continues to strengthen then look for a breakout later today through 1.1880.
This article was originally posted on FX Empire
