
 Yahoo Finance
 EUR/USD Mid-Session Technical Analysis for June 15, 2018
The Euro is recovering from an early session loss on Friday, most likely being fueled by short-covering and profit-taking after Thursday’s steep break.
At 0731 GMT, the EUR/USD is trading 1.1567, up 0.0003 or +0.03%.
The fundamentals are bearish so we expect to see further downside pressure over the near-term as investors are likely to continue to adjust positions in reaction to the newly revealed moves by the European Central Bank.
On Thursday, the ECB triggered a plunge in the single-currency after it said it would extend stimulus into December and it was not likely to raise interest rates until July 2019.
Daily Swing Chart Technical Analysis
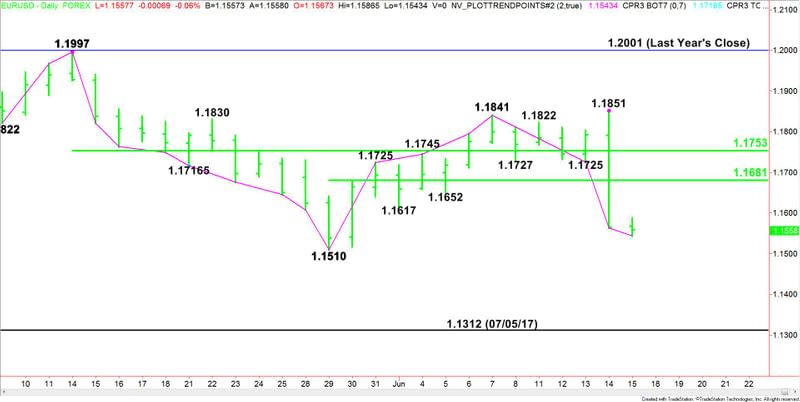
The main trend is down according to the daily swing chart. During Thursday’s wild trading session, the EUR/USD trend turned up on a trade though 1.1841, but was almost immediately met by strong selling pressure at 1.1851. This was enough to drive the Forex pair through 1.1725, changing the main trend to down.
The minor trend is also down. It initially turned down on the move through 1.1725 then reaffirmed when sellers took out minor bottoms at 1.1652 and 1.1617.
Adding further to the weakness and downside momentum was the formation of the closing price reversal top at 1.1851. This chart pattern was reaffirmed early Friday. It often leads to a 2 to 3 day break.
Daily Swing Chart Technical Forecast
The EUR/USD is currently trading inside a pair of ranges. The first is 1.1997 to 1.1510. Its 50% level is 1.1753. The second is 1.1510 to 1.1851. Its 50% level is 1.1681. The two 50% levels are resistance.
Due to the steep sell-off on Thursday and the subsequent follow-through selling on Friday, we’re going to watch yesterday’s close at 1.1565 for direction today.
A sustained move over 1.1565 will indicate the presence of buyers. If this move generates enough upside momentum then we could see a short-covering rally with 1.1681 the next likely target.
A sustained move under 1.1565 will signal the presence of sellers. This could trigger an extension of the selling into the 1.1510 main bottom.
The bottom at 1.1510 is a potential trigger point for an acceleration to the downside with the July 5, 2017 main bottom at 1.1312 the next likely downside target.
This article was originally posted on FX Empire
