
 Yahoo Finance
 Equals Group (LON:EQLS) shareholders have earned a 99% return over the last year
Passive investing in index funds can generate returns that roughly match the overall market. But if you pick the right individual stocks, you could make more than that. For example, the Equals Group plc (LON:EQLS) share price is up 99% in the last 1 year, clearly besting the market decline of around 4.0% (not including dividends). So that should have shareholders smiling. Zooming out, the stock is actually down 22% in the last three years.
Let's take a look at the underlying fundamentals over the longer term, and see if they've been consistent with shareholders returns.
View our latest analysis for Equals Group
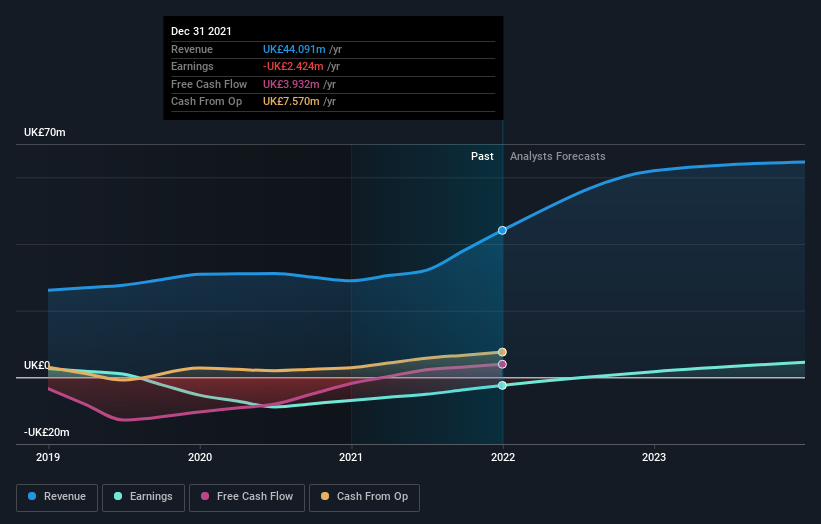
Equals Group wasn't profitable in the last twelve months, it is unlikely we'll see a strong correlation between its share price and its earnings per share (EPS). Arguably revenue is our next best option. When a company doesn't make profits, we'd generally expect to see good revenue growth. That's because fast revenue growth can be easily extrapolated to forecast profits, often of considerable size.
Equals Group grew its revenue by 52% last year. That's stonking growth even when compared to other loss-making stocks. While the share price gain of 99% over twelve months is pretty tasty, you might argue it doesn't fully reflect the strong revenue growth. If that's the case, now might be the time to take a close look at Equals Group. Since we evolved from monkeys, we think in linear terms by nature. So if growth goes exponential, opportunity may exist for the enlightened.
You can see how earnings and revenue have changed over time in the image below (click on the chart to see the exact values).
You can see how its balance sheet has strengthened (or weakened) over time in this free interactive graphic.
A Different Perspective
It's good to see that Equals Group has rewarded shareholders with a total shareholder return of 99% in the last twelve months. Since the one-year TSR is better than the five-year TSR (the latter coming in at 8% per year), it would seem that the stock's performance has improved in recent times. Given the share price momentum remains strong, it might be worth taking a closer look at the stock, lest you miss an opportunity. I find it very interesting to look at share price over the long term as a proxy for business performance. But to truly gain insight, we need to consider other information, too. For instance, we've identified 1 warning sign for Equals Group that you should be aware of.
If you are like me, then you will not want to miss this free list of growing companies that insiders are buying.
Please note, the market returns quoted in this article reflect the market weighted average returns of stocks that currently trade on GB exchanges.
Have feedback on this article? Concerned about the content? Get in touch with us directly. Alternatively, email editorial-team (at) simplywallst.com.
This article by Simply Wall St is general in nature. We provide commentary based on historical data and analyst forecasts only using an unbiased methodology and our articles are not intended to be financial advice. It does not constitute a recommendation to buy or sell any stock, and does not take account of your objectives, or your financial situation. We aim to bring you long-term focused analysis driven by fundamental data. Note that our analysis may not factor in the latest price-sensitive company announcements or qualitative material. Simply Wall St has no position in any stocks mentioned.
