
 Yahoo Finance
 Is Entergy Corporation's (NYSE:ETR) P/E Ratio Really That Good?

Want to participate in a short research study? Help shape the future of investing tools and you could win a $250 gift card!
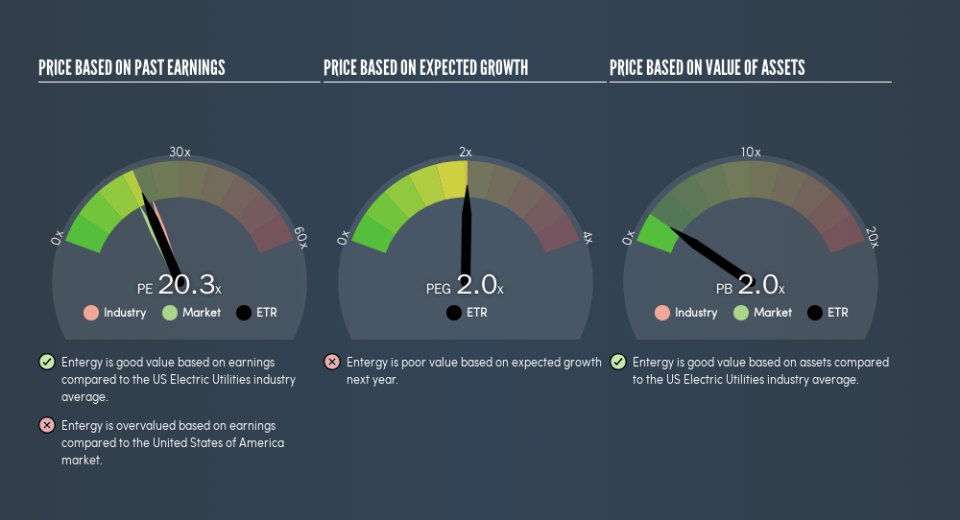
This article is for investors who would like to improve their understanding of price to earnings ratios (P/E ratios). We'll look at Entergy Corporation's (NYSE:ETR) P/E ratio and reflect on what it tells us about the company's share price. What is Entergy's P/E ratio? Well, based on the last twelve months it is 20.31. That corresponds to an earnings yield of approximately 4.9%.
See our latest analysis for Entergy
How Do You Calculate Entergy's P/E Ratio?
The formula for price to earnings is:
Price to Earnings Ratio = Share Price ÷ Earnings per Share (EPS)
Or for Entergy:
P/E of 20.31 = $95 ÷ $4.68 (Based on the trailing twelve months to December 2018.)
Is A High Price-to-Earnings Ratio Good?
A higher P/E ratio means that investors are paying a higher price for each $1 of company earnings. That isn't necessarily good or bad, but a high P/E implies relatively high expectations of what a company can achieve in the future.
How Growth Rates Impact P/E Ratios
Earnings growth rates have a big influence on P/E ratios. When earnings grow, the 'E' increases, over time. That means even if the current P/E is high, it will reduce over time if the share price stays flat. Then, a lower P/E should attract more buyers, pushing the share price up.
In the last year, Entergy grew EPS like Taylor Swift grew her fan base back in 2010; the 104% gain was both fast and well deserved.
Does Entergy Have A Relatively High Or Low P/E For Its Industry?
The P/E ratio indicates whether the market has higher or lower expectations of a company. We can see in the image below that the average P/E (22.1) for companies in the electric utilities industry is higher than Entergy's P/E.
Entergy's P/E tells us that market participants think it will not fare as well as its peers in the same industry. Since the market seems unimpressed with Entergy, it's quite possible it could surprise on the upside. If you consider the stock interesting, further research is recommended. For example, I often monitor director buying and selling.
Don't Forget: The P/E Does Not Account For Debt or Bank Deposits
It's important to note that the P/E ratio considers the market capitalization, not the enterprise value. Thus, the metric does not reflect cash or debt held by the company. Theoretically, a business can improve its earnings (and produce a lower P/E in the future) by investing in growth. That means taking on debt (or spending its cash).
While growth expenditure doesn't always pay off, the point is that it is a good option to have; but one that the P/E ratio ignores.
So What Does Entergy's Balance Sheet Tell Us?
Entergy has net debt worth 98% of its market capitalization. This is enough debt that you'd have to make some adjustments before using the P/E ratio to compare it to a company with net cash.
The Bottom Line On Entergy's P/E Ratio
Entergy has a P/E of 20.3. That's higher than the average in the US market, which is 18.3. While its debt levels are rather high, at least its EPS is growing quickly. So it seems likely the market is overlooking the debt because of the fast earnings growth.
Investors should be looking to buy stocks that the market is wrong about. As value investor Benjamin Graham famously said, 'In the short run, the market is a voting machine but in the long run, it is a weighing machine.' So this free visualization of the analyst consensus on future earnings could help you make the right decision about whether to buy, sell, or hold.
You might be able to find a better buy than Entergy. If you want a selection of possible winners, check out this free list of interesting companies that trade on a P/E below 20 (but have proven they can grow earnings).
We aim to bring you long-term focused research analysis driven by fundamental data. Note that our analysis may not factor in the latest price-sensitive company announcements or qualitative material.
If you spot an error that warrants correction, please contact the editor at editorial-team@simplywallst.com. This article by Simply Wall St is general in nature. It does not constitute a recommendation to buy or sell any stock, and does not take account of your objectives, or your financial situation. Simply Wall St has no position in the stocks mentioned. Thank you for reading.
