
 Yahoo Finance
 Is Enerplus Corporation (TSE:ERF) Attractive At Its Current PE Ratio?

I am writing today to help inform people who are new to the stock market and want to begin learning about how to value company based on its current earnings and what are the drawbacks of this method.
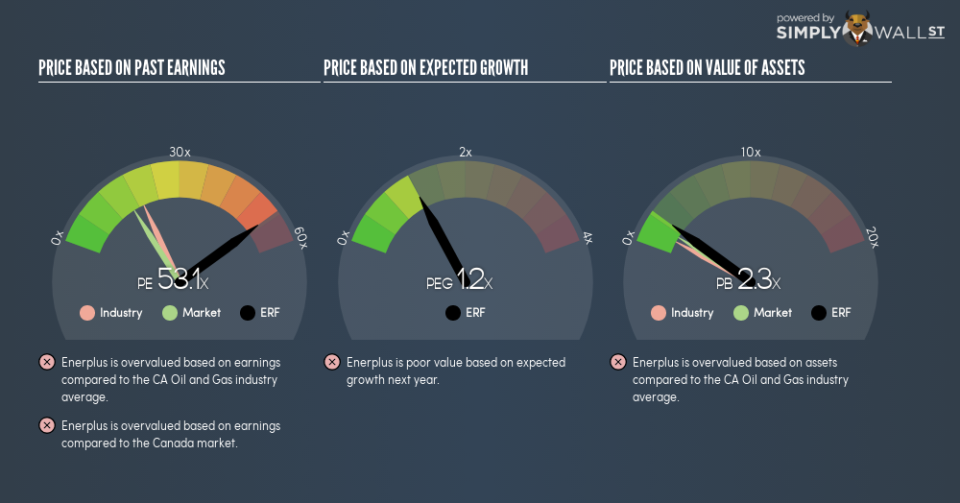
Enerplus Corporation (TSE:ERF) is currently trading at a trailing P/E of 53.1, which is higher than the industry average of 19.9. While this might not seem positive, it is important to understand the assumptions behind the P/E ratio before you make any investment decisions. Today, I will break down what the P/E ratio is, how to interpret it and what to watch out for.
Check out our latest analysis for Enerplus
Breaking down the P/E ratio
A common ratio used for relative valuation is the P/E ratio. By comparing a stock’s price per share to its earnings per share, we are able to see how much investors are paying for each dollar of the company’s earnings.
P/E Calculation for ERF
Price-Earnings Ratio = Price per share ÷ Earnings per share
ERF Price-Earnings Ratio = CA$16.04 ÷ CA$0.302 = 53.1x
The P/E ratio isn’t a metric you view in isolation and only becomes useful when you compare it against other similar companies. Our goal is to compare the stock’s P/E ratio to the average of companies that have similar attributes to ERF, such as company lifetime and products sold. A common peer group is companies that exist in the same industry, which is what I use. ERF’s P/E of 53.1 is higher than its industry peers (19.9), which implies that each dollar of ERF’s earnings is being overvalued by investors. This multiple is a median of profitable companies of 25 Oil and Gas companies in CA including McChip Resources, Pinedale Energy and Greencastle Resources. You could think of it like this: the market is pricing ERF as if it is a stronger company than the average of its industry group.
Assumptions to watch out for
However, it is important to note that our examination of the stock is based on certain assumptions. The first is that our “similar companies” are actually similar to ERF. If not, the difference in P/E might be a result of other factors. For example, if Enerplus Corporation is growing faster than its peers, then it would deserve a higher P/E ratio. Of course, it is possible that the stocks we are comparing with ERF are not fairly valued. Thus while we might conclude that it is richly valued relative to its peers, that could be explained by the peer group being undervalued.
What this means for you:
If your personal research into the stock confirms what the P/E ratio is telling you, it might be a good time to rebalance your portfolio and reduce your holdings in ERF. But keep in mind that the usefulness of relative valuation depends on whether you are comfortable with making the assumptions I mentioned above. Remember that basing your investment decision off one metric alone is certainly not sufficient. There are many things I have not taken into account in this article and the PE ratio is very one-dimensional. If you have not done so already, I highly recommend you to complete your research by taking a look at the following:
Future Outlook: What are well-informed industry analysts predicting for ERF’s future growth? Take a look at our free research report of analyst consensus for ERF’s outlook.
Past Track Record: Has ERF been consistently performing well irrespective of the ups and downs in the market? Go into more detail in the past performance analysis and take a look at the free visual representations of ERF’s historicals for more clarity.
Other High-Performing Stocks: Are there other stocks that provide better prospects with proven track records? Explore our free list of these great stocks here.
To help readers see past the short term volatility of the financial market, we aim to bring you a long-term focused research analysis purely driven by fundamental data. Note that our analysis does not factor in the latest price-sensitive company announcements.
The author is an independent contributor and at the time of publication had no position in the stocks mentioned. For errors that warrant correction please contact the editor at editorial-team@simplywallst.com.
