
 Yahoo Finance
 Are Empire Company Limited’s Returns On Capital Worth Investigating?

Today we'll evaluate Empire Company Limited (TSE:EMP.A) to determine whether it could have potential as an investment idea. Specifically, we're going to calculate its Return On Capital Employed (ROCE), in the hopes of getting some insight into the business.
First up, we'll look at what ROCE is and how we calculate it. Next, we'll compare it to others in its industry. Finally, we'll look at how its current liabilities affect its ROCE.
Understanding Return On Capital Employed (ROCE)
ROCE measures the 'return' (pre-tax profit) a company generates from capital employed in its business. Generally speaking a higher ROCE is better. Overall, it is a valuable metric that has its flaws. Renowned investment researcher Michael Mauboussin has suggested that a high ROCE can indicate that 'one dollar invested in the company generates value of more than one dollar'.
How Do You Calculate Return On Capital Employed?
Analysts use this formula to calculate return on capital employed:
Return on Capital Employed = Earnings Before Interest and Tax (EBIT) ÷ (Total Assets - Current Liabilities)
Or for Empire:
0.096 = CA$999m ÷ (CA$14b - CA$3.6b) (Based on the trailing twelve months to February 2020.)
Therefore, Empire has an ROCE of 9.6%.
See our latest analysis for Empire
Does Empire Have A Good ROCE?
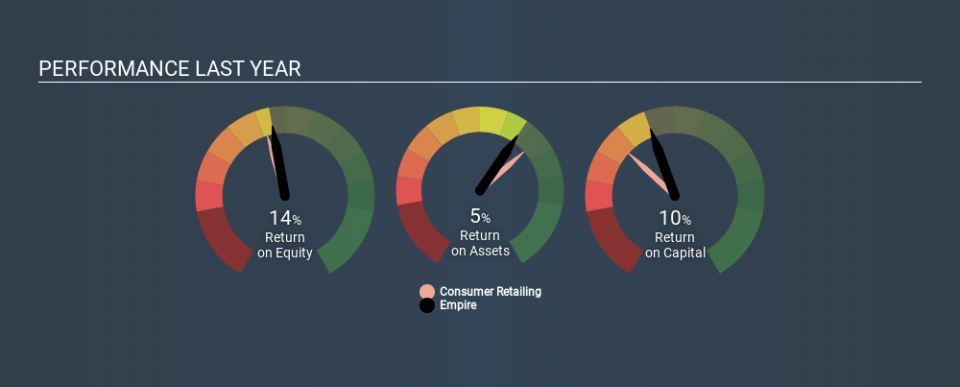
ROCE can be useful when making comparisons, such as between similar companies. We can see Empire's ROCE is around the 9.2% average reported by the Consumer Retailing industry. Separate from Empire's performance relative to its industry, its ROCE in absolute terms looks satisfactory, and it may be worth researching in more depth.
Our data shows that Empire currently has an ROCE of 9.6%, compared to its ROCE of 6.3% 3 years ago. This makes us wonder if the company is improving. You can see in the image below how Empire's ROCE compares to its industry. Click to see more on past growth.
When considering this metric, keep in mind that it is backwards looking, and not necessarily predictive. ROCE can be deceptive for cyclical businesses, as returns can look incredible in boom times, and terribly low in downturns. This is because ROCE only looks at one year, instead of considering returns across a whole cycle. Future performance is what matters, and you can see analyst predictions in our free report on analyst forecasts for the company.
What Are Current Liabilities, And How Do They Affect Empire's ROCE?
Current liabilities are short term bills and invoices that need to be paid in 12 months or less. Due to the way ROCE is calculated, a high level of current liabilities makes a company look as though it has less capital employed, and thus can (sometimes unfairly) boost the ROCE. To counter this, investors can check if a company has high current liabilities relative to total assets.
Empire has current liabilities of CA$3.6b and total assets of CA$14b. As a result, its current liabilities are equal to approximately 26% of its total assets. Current liabilities are minimal, limiting the impact on ROCE.
Our Take On Empire's ROCE
Overall, Empire has a decent ROCE and could be worthy of further research. Empire looks strong on this analysis, but there are plenty of other companies that could be a good opportunity . Here is a free list of companies growing earnings rapidly.
If you are like me, then you will not want to miss this free list of growing companies that insiders are buying.
If you spot an error that warrants correction, please contact the editor at editorial-team@simplywallst.com. This article by Simply Wall St is general in nature. It does not constitute a recommendation to buy or sell any stock, and does not take account of your objectives, or your financial situation. Simply Wall St has no position in the stocks mentioned.
We aim to bring you long-term focused research analysis driven by fundamental data. Note that our analysis may not factor in the latest price-sensitive company announcements or qualitative material. Thank you for reading.
