
 Yahoo Finance
 Is Electro Scientific Industries Inc (NASDAQ:ESIO) A Financially Sound Company?

Electro Scientific Industries Inc (NASDAQ:ESIO) is a small-cap stock with a market capitalization of US$572.27m. While investors primarily focus on the growth potential and competitive landscape of the small-cap companies, they end up ignoring a key aspect, which could be the biggest threat to its existence: its financial health. Why is it important? Companies operating in the Electronic industry, even ones that are profitable, are more likely to be higher risk. Evaluating financial health as part of your investment thesis is vital. Here are a few basic checks that are good enough to have a broad overview of the company’s financial strength. However, since I only look at basic financial figures, I recommend you dig deeper yourself into ESIO here.
How does ESIO’s operating cash flow stack up against its debt?
ESIO has shrunken its total debt levels in the last twelve months, from US$13.92m to US$13.19m – this includes both the current and long-term debt. With this reduction in debt, ESIO’s cash and short-term investments stands at US$123.91m , ready to deploy into the business. On top of this, ESIO has produced cash from operations of US$67.43m during the same period of time, resulting in an operating cash to total debt ratio of 511.32%, indicating that ESIO’s debt is appropriately covered by operating cash. This ratio can also be a sign of operational efficiency as an alternative to return on assets. In ESIO’s case, it is able to generate 5.11x cash from its debt capital.
Can ESIO pay its short-term liabilities?
With current liabilities at US$81.71m, it seems that the business has been able to meet these obligations given the level of current assets of US$284.87m, with a current ratio of 3.49x. Though, anything above 3x is considered high and could mean that ESIO has too much idle capital in low-earning investments.
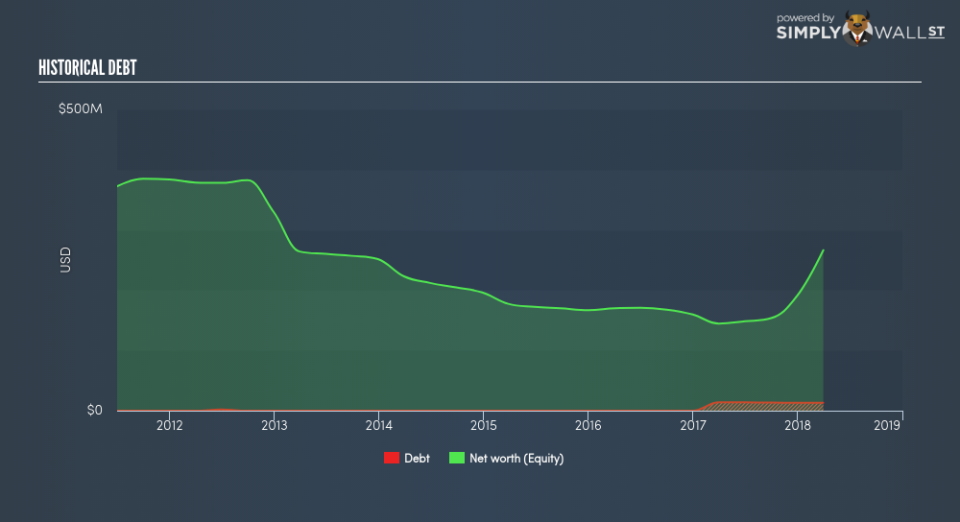
Does ESIO face the risk of succumbing to its debt-load?
With a debt-to-equity ratio of 4.95%, ESIO’s debt level is relatively low. ESIO is not taking on too much debt commitment, which may be constraining for future growth.
Next Steps:
ESIO has demonstrated its ability to generate sufficient levels of cash flow, while its debt hovers at a safe level. Furthermore, the company exhibits an ability to meet its near term obligations should an adverse event occur. This is only a rough assessment of financial health, and I’m sure ESIO has company-specific issues impacting its capital structure decisions. I suggest you continue to research Electro Scientific Industries to get a better picture of the stock by looking at:
Future Outlook: What are well-informed industry analysts predicting for ESIO’s future growth? Take a look at our free research report of analyst consensus for ESIO’s outlook.
Valuation: What is ESIO worth today? Is the stock undervalued, even when its growth outlook is factored into its intrinsic value? The intrinsic value infographic in our free research report helps visualize whether ESIO is currently mispriced by the market.
Other High-Performing Stocks: Are there other stocks that provide better prospects with proven track records? Explore our free list of these great stocks here.
To help readers see pass the short term volatility of the financial market, we aim to bring you a long-term focused research analysis purely driven by fundamental data. Note that our analysis does not factor in the latest price sensitive company announcements.
The author is an independent contributor and at the time of publication had no position in the stocks mentioned.
