
 Yahoo Finance
 Earnings Not Telling The Story For Lundin Gold Inc. (TSE:LUG)
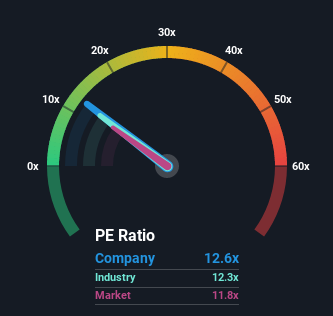
There wouldn't be many who think Lundin Gold Inc.'s (TSE:LUG) price-to-earnings (or "P/E") ratio of 12.6x is worth a mention when the median P/E in Canada is similar at about 12x. Although, it's not wise to simply ignore the P/E without explanation as investors may be disregarding a distinct opportunity or a costly mistake.
With earnings growth that's superior to most other companies of late, Lundin Gold has been doing relatively well. One possibility is that the P/E is moderate because investors think this strong earnings performance might be about to tail off. If you like the company, you'd be hoping this isn't the case so that you could potentially pick up some stock while it's not quite in favour.
View our latest analysis for Lundin Gold
Want the full picture on analyst estimates for the company? Then our free report on Lundin Gold will help you uncover what's on the horizon.
How Is Lundin Gold's Growth Trending?
Lundin Gold's P/E ratio would be typical for a company that's only expected to deliver moderate growth, and importantly, perform in line with the market.
Retrospectively, the last year delivered an exceptional 224% gain to the company's bottom line. Still, EPS has barely risen at all from three years ago in total, which is not ideal. Therefore, it's fair to say that earnings growth has been inconsistent recently for the company.
Shifting to the future, estimates from the six analysts covering the company suggest earnings growth is heading into negative territory, declining 17% per annum over the next three years. That's not great when the rest of the market is expected to grow by 13% each year.
In light of this, it's somewhat alarming that Lundin Gold's P/E sits in line with the majority of other companies. Apparently many investors in the company reject the analyst cohort's pessimism and aren't willing to let go of their stock right now. There's a good chance these shareholders are setting themselves up for future disappointment if the P/E falls to levels more in line with the negative growth outlook.
What We Can Learn From Lundin Gold's P/E?
It's argued the price-to-earnings ratio is an inferior measure of value within certain industries, but it can be a powerful business sentiment indicator.
We've established that Lundin Gold currently trades on a higher than expected P/E for a company whose earnings are forecast to decline. When we see a poor outlook with earnings heading backwards, we suspect share price is at risk of declining, sending the moderate P/E lower. This places shareholders' investments at risk and potential investors in danger of paying an unnecessary premium.
Before you settle on your opinion, we've discovered 3 warning signs for Lundin Gold (1 is concerning!) that you should be aware of.
If P/E ratios interest you, you may wish to see this free collection of other companies that have grown earnings strongly and trade on P/E's below 20x.
Have feedback on this article? Concerned about the content? Get in touch with us directly. Alternatively, email editorial-team (at) simplywallst.com.
This article by Simply Wall St is general in nature. We provide commentary based on historical data and analyst forecasts only using an unbiased methodology and our articles are not intended to be financial advice. It does not constitute a recommendation to buy or sell any stock, and does not take account of your objectives, or your financial situation. We aim to bring you long-term focused analysis driven by fundamental data. Note that our analysis may not factor in the latest price-sensitive company announcements or qualitative material. Simply Wall St has no position in any stocks mentioned.
