
 Yahoo Finance
 Earnings Not Telling The Story For BlackRock, Inc. (NYSE:BLK)
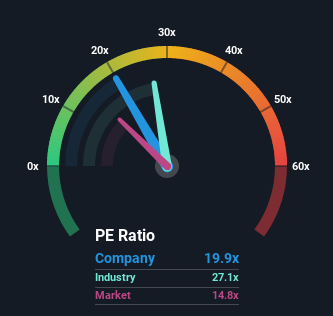
With a price-to-earnings (or "P/E") ratio of 19.9x BlackRock, Inc. (NYSE:BLK) may be sending bearish signals at the moment, given that almost half of all companies in the United States have P/E ratios under 14x and even P/E's lower than 8x are not unusual. Nonetheless, we'd need to dig a little deeper to determine if there is a rational basis for the elevated P/E.
BlackRock could be doing better as its earnings have been going backwards lately while most other companies have been seeing positive earnings growth. One possibility is that the P/E is high because investors think this poor earnings performance will turn the corner. You'd really hope so, otherwise you're paying a pretty hefty price for no particular reason.
View our latest analysis for BlackRock
If you'd like to see what analysts are forecasting going forward, you should check out our free report on BlackRock.
How Is BlackRock's Growth Trending?
The only time you'd be truly comfortable seeing a P/E as high as BlackRock's is when the company's growth is on track to outshine the market.
Taking a look back first, the company's earnings per share growth last year wasn't something to get excited about as it posted a disappointing decline of 3.5%. However, a few very strong years before that means that it was still able to grow EPS by an impressive 42% in total over the last three years. Accordingly, while they would have preferred to keep the run going, shareholders would probably welcome the medium-term rates of earnings growth.
Turning to the outlook, the next three years should generate growth of 0.7% per year as estimated by the eleven analysts watching the company. That's shaping up to be materially lower than the 9.0% per annum growth forecast for the broader market.
In light of this, it's alarming that BlackRock's P/E sits above the majority of other companies. It seems most investors are hoping for a turnaround in the company's business prospects, but the analyst cohort is not so confident this will happen. Only the boldest would assume these prices are sustainable as this level of earnings growth is likely to weigh heavily on the share price eventually.
The Key Takeaway
We'd say the price-to-earnings ratio's power isn't primarily as a valuation instrument but rather to gauge current investor sentiment and future expectations.
Our examination of BlackRock's analyst forecasts revealed that its inferior earnings outlook isn't impacting its high P/E anywhere near as much as we would have predicted. Right now we are increasingly uncomfortable with the high P/E as the predicted future earnings aren't likely to support such positive sentiment for long. Unless these conditions improve markedly, it's very challenging to accept these prices as being reasonable.
Don't forget that there may be other risks. For instance, we've identified 1 warning sign for BlackRock that you should be aware of.
Of course, you might find a fantastic investment by looking at a few good candidates. So take a peek at this free list of companies with a strong growth track record, trading on a P/E below 20x.
Have feedback on this article? Concerned about the content? Get in touch with us directly. Alternatively, email editorial-team (at) simplywallst.com.
This article by Simply Wall St is general in nature. We provide commentary based on historical data and analyst forecasts only using an unbiased methodology and our articles are not intended to be financial advice. It does not constitute a recommendation to buy or sell any stock, and does not take account of your objectives, or your financial situation. We aim to bring you long-term focused analysis driven by fundamental data. Note that our analysis may not factor in the latest price-sensitive company announcements or qualitative material. Simply Wall St has no position in any stocks mentioned.
Join A Paid User Research Session
You’ll receive a US$30 Amazon Gift card for 1 hour of your time while helping us build better investing tools for the individual investors like yourself. Sign up here
