
 Yahoo Finance
 Has Earnings Growth Peaked Already?


We still have a few more weeks to go before the big banks start reporting June-quarter results. But the Q2 reporting cycle has (officially) gotten underway, with results from 9 S&P 500 members already out. All of these early earnings releases are from companies that have fiscal quarters ending in May, but these get counted as part of the June-quarter tally.
We have another 11 index members with fiscal quarters ending in May on deck to report results this week. All in all, we will have seen such Q2 results from almost two dozen S&P 500 members by the time JPMorgan (JPM), Wells Fargo (WFC) and Citigroup (C) (unofficially) kick-off this earnings season on July 13th.
The notable earnings reports coming out this week include:
Lennar (LEN) reports on Tuesday (6/26) before the market’s open, with the homebuilder expected to earn $0.45 per share in earnings on $5.23 billion in revenues, which compares to $0.91 per share on $3.26 billion in revenues in the year-earlier period. The stock was up big following the last earnings release, but overall it has been a tough period for Lennar shares as well as the broader homebuilder space.
Lennar shares are currently trading close to 52-week lows and are now down -18.8% since the start of the year, underperforming the Zacks Construction sector’s -8.1% year-to-date decline vs. the S&P 500 index’s +4% gain. KB Home (KBH), which is scheduled to report results Thursday morning (06/28) is down even more than Lennar (down -19.9% YTD).
General Mills (GIS) reports on Wednesday (6/27) morning, with the company expected to earn $0.75 per share on $3.91 billion in revenues, which compares to $0.73 per share on $3.81 billion in revenues in the year-earlier period. Estimates have come down a bit in recent days and the stock has lost ground following each of the last two earnings reports. The stock was down big in the run up to and the day of the last earning release on March 21st and has essentially remained flat since then. General Mills shares are currently down -22.3% since the start of the year, underperforming the struggling Consumer Staples sector’s -10.3% year-to-date decline.
Nike (NKE) reports after the market’s close on Thursday (6/28), with the company expected to earn $0.64 in EPS on $9.39 billion in revenues, which compares to $0.60 EPS on $8.68 billion in revenues in the year-earlier period. The stock was down following each of the last three earning releases, but has been an impressive performer this year, outperforming the Zacks Consumer Discretionary sector as well as the broader market. Nike shares are currently trading close to their 52-high and are up +18.6% vs. the Consumer Discretionary sector’s +4.7% year-to-date period.
Accenture (ACN) will report before the market’s open on Thursday (6/28), with the company expected to earn $1.71 per share in earnings on $10.02 billion in revenues, up +12.5% and +13% from the year-earlier period, respectively. Accenture has been spotlighting its opportunity in the digital, cloud and security areas in recent quarters and revenues from those areas should show strong momentum in this release as well. Management’s commentary about technology spending trends typically has read through for IBM (IBM) and Hewlett Packard Enterprise (HPE). The stock was down big following the last quarterly release on March 22nd, but has recovered since then and is currently up +4.9% in the year-to-date period.
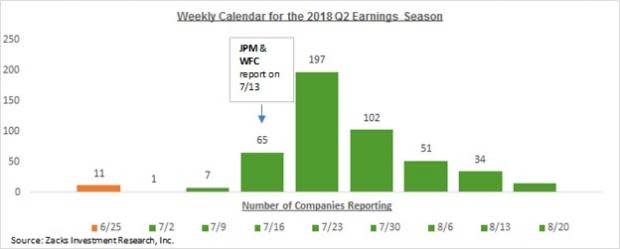
The chart below of weekly reporting calendar for the S&P 500 index clearly shows that we still have another three weeks to go before the Q2 earnings season really takes off.
Expectations for Q2
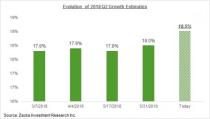
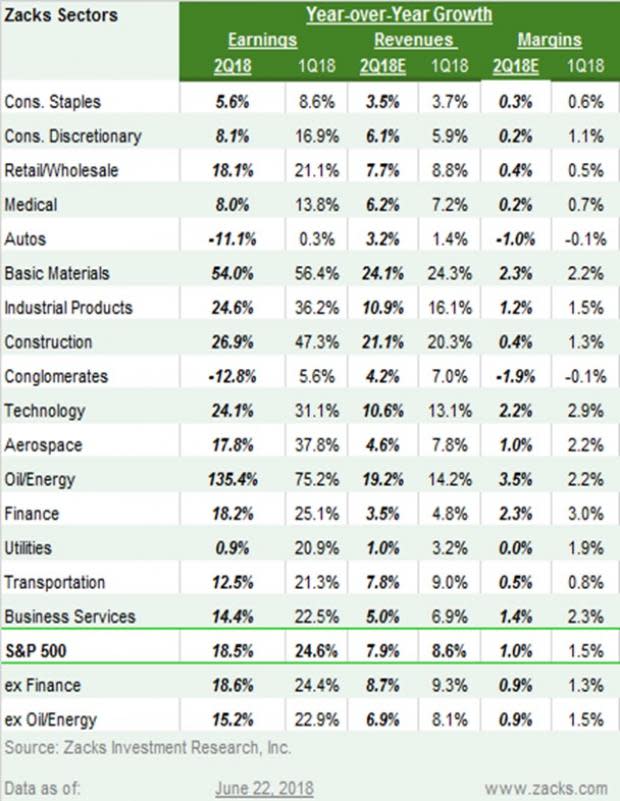
Total Q2 earnings are expected to be up +18.5% from the same period last year on +7.9% higher revenues, with double-digit earnings growth for 10 of the 16 Zacks sectors. This would follow +24.6% earnings growth in 2018 Q1 on +8.6%, the highest growth in almost 7 years.
The chart below plots the evolution of Q2 earnings growth expectations. As you can see, the growth rate has ticked up a bit, partly reflecting results from the 9 S&P 500 members that have reported results already. But even after accounting for the results that have come out, Q2 estimates revisions are nowhere near the impressive positive revisions we saw ahead of the start of the Q1 earnings season.

A big part of the positive revisions we saw ahead of the start of the Q1 earnings season reflected the direct impact of the tax law changes, which was obviously a one-off development. Had all positive revisions been a result of tax law changes, we would have seen only EPS estimates go up, with no changes to revenue estimates. But that wasn’t the case, as revenue estimates had gone up as well, which raised our hopes that the aggregate revisions trend had finally turned positive after many years being in the other direction.
But as the chart above shows, we didn’t see much in positive revisions. In other words, while the overall growth picture remains very strong – there is no other way to describe +18.5% quarterly earnings growth - there is not much improvement in expectations for Q2 and beyond. The recent strength in the exchange value of the U.S. dollar and questions about global growth will likely serve as incremental negatives for folks like us monitoring the aggregate revisions trend.
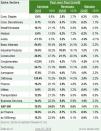
This flattish aggregate revisions trend notwithstanding, June quarter estimates have actually modestly ticked down for 9 of the 16 Zacks sectors and gone up for 7 sectors. The sectors enjoying positive revisions in the aggregate include Technology, Energy, Medical, Industrial Products, Basic Materials, Business Services, and Retail. Estimates have gone up the most for the Energy sector, reflecting momentum in oil prices. Excluding the gains made in the Energy sector, the aggregate revisions picture for the S&P 500 index would be in negative territory.
The table below shows the summary picture for Q2, contrasted with what was actually achieved in Q1.
The Earnings Growth Peak
The chart below compares current Q2 earnings growth expectations with what was actually achieved in the preceding 5 quarters and what is expected in the following 3 quarters.
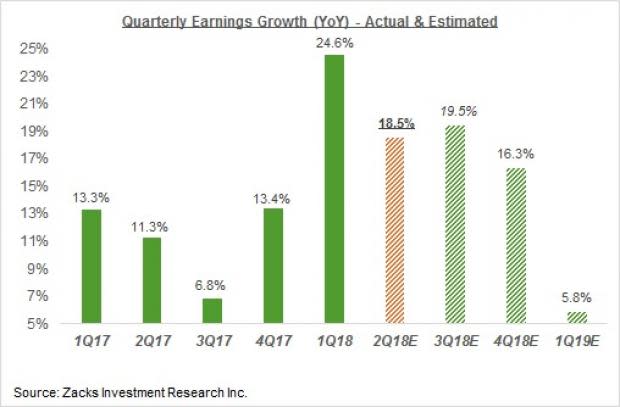
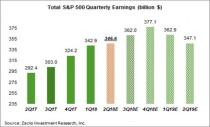
Please note that while the Q2 growth pace represents a deceleration from the preceding quarter’s impressive level, the overall level of total earnings is in record territory, as the chart below shows.

The two charts above provide different answers to the ‘peak earnings’ question. The first chart shows that the growth rate likely peaked in 2018 Q1, while dollar earnings aren’t expected to ‘peak’ till the last quarter of 2018. Even with respect to the growth rate, it is very much possible that final growth rates for Q2 and Q3 may surpass what we saw in Q1.
We should keep in mind that this earnings cycle got underway back in 2009 when the U.S. economy got out of its last recession. By this time, earnings growth should have come down to the historical ‘normalized’ pace in the mid-single digits level. The reason we have these impressive growth numbers and positive revisions trend is thanks mostly to the effect of the tax cuts, which will start wearing off towards the end of 2019.
In other words, earnings likely haven’t peaked yet. But with this cycle so long in tooth, we are steadily moving towards that stage.
Today's Stocks from Zacks' Hottest Strategies
It's hard to believe, even for us at Zacks. But while the market gained +21.9% in 2017, our top stock-picking screens have returned +115.0%, +109.3%, +104.9%, +98.6%, and +67.1%.
And this outperformance has not just been a recent phenomenon. Over the years it has been remarkably consistent. From 2000 - 2017, the composite yearly average gain for these strategies has beaten the market more than 19X over. Maybe even more remarkable is the fact that we're willing to share their latest stocks with you without cost or obligation.
See Them Free>>
Here is a list of the 36 companies including 11 S&P 500 and reporting this week.
Company | Ticker | Current Qtr | Year-Ago Qtr | Last EPS Surprise % | Report Day | Time |
CARNIVAL CORP | CCL | 0.6 | 0.52 | 20.93% | Monday | BTO |
IHS MARKIT LTD | INFO | 0.46 | 0.42 | 12.82% | Tuesday | BTO |
LENNAR CORP -A | LEN | 0.45 | 0.91 | 20.65% | Tuesday | BTO |
JINKOSOLAR HLDG | JKS | 0.07 | 0.28 | -47.83% | Tuesday | BTO |
FACTSET RESH | FDS | 2.14 | 1.85 | 3.41% | Tuesday | BTO |
SCHNITZER STEEL | SCHN | 1.25 | 0.56 | -1.10% | Tuesday | BTO |
AEROVIRONMENT | AVAV | 0.52 | 1.3 | 0.00% | Tuesday | AMC |
DANAOS CORP | DAC | 0.18 | 0.22 | 33.33% | Tuesday | AMC |
DETERMINE INC | DTRM | -0.13 | -0.1 | 29.41% | Tuesday | AMC |
SONIC CORP | SONC | 0.49 | 0.43 | 13.33% | Tuesday | AMC |
GENL MILLS | GIS | 0.75 | 0.73 | 0.00% | Wednesday | BTO |
PAYCHEX INC | PAYX | 0.61 | 0.54 | 1.61% | Wednesday | BTO |
UNIFIRST CORP | UNF | 1.56 | 1.36 | 28.97% | Wednesday | BTO |
EROS INTL PLC | EROS | 0.15 | -0.04 | -50.00% | Wednesday | BTO |
PIER 1 IMPORTS | PIR | -0.4 | -0.04 | 16.67% | Wednesday | AMC |
NOVAGOLD RSRCS | NG | -0.02 | -0.03 | -50.00% | Wednesday | AMC |
BED BATH&BEYOND | BBBY | 0.32 | 0.58 | 4.96% | Wednesday | AMC |
FRANKLIN COVEY | FC | -0.23 | -0.23 | 3.33% | Wednesday | AMC |
FULLER(HB) CO | FUL | 0.86 | 0.62 | 0.00% | Wednesday | AMC |
CALAMP CORP | CAMP | 0.21 | 0.26 | 0.00% | Wednesday | AMC |
INVESTORS RL ES | IRET | 0.09 | 0.11 | -10.00% | Wednesday | AMC |
RITE AID CORP | RAD | 0 | -0.05 | 50.00% | Wednesday | AMC |
PROGRESS SOFTWA | PRGS | 0.44 | 0.37 | 15.79% | Wednesday | AMC |
ACCENTURE PLC | ACN | 1.71 | 1.52 | 5.33% | Thursday | BTO |
CONAGRA BRANDS | CAG | 0.43 | 0.37 | 8.93% | Thursday | BTO |
MCCORMICK & CO | MKC | 0.93 | 0.82 | 9.89% | Thursday | BTO |
WALGREENS BAI | WBA | 1.47 | 1.33 | 11.61% | Thursday | BTO |
GMS INC | GMS | 0.67 | 0.48 | -55.00% | Thursday | BTO |
LINDSAY CORP | LNN | 1.39 | 1.02 | 0.00% | Thursday | BTO |
OMNOVA SOLUTION | OMN | 0.19 | 0.16 | 28.57% | Thursday | BTO |
SHAW COMMS-CL B | SJR | 0.28 | 0.25 | 73.91% | Thursday | BTO |
APOGEE ENTRPRS | APOG | 0.52 | 0.62 | 7.79% | Thursday | BTO |
NIKE INC-B | NKE | 0.64 | 0.6 | 30.77% | Thursday | AMC |
KB HOME | KBH | 0.49 | 0.33 | 33.33% | Thursday | AMC |
SYNNEX CORP | SNX | 2.3 | 2.08 | 1.42% | Thursday | AMC |
CONSTELLATN BRD | STZ | 2.42 | 2.34 | 9.20% | Friday | BTO |
Want the latest recommendations from Zacks Investment Research? Today, you can download 7 Best Stocks for the Next 30 Days. Click to get this free report
Wells Fargo & Company (WFC) : Free Stock Analysis Report
NIKE, Inc. (NKE) : Free Stock Analysis Report
Lennar Corporation (LEN) : Free Stock Analysis Report
KB Home (KBH) : Free Stock Analysis Report
JPMorgan Chase & Co. (JPM) : Free Stock Analysis Report
International Business Machines Corporation (IBM) : Free Stock Analysis Report
Hewlett Packard Enterprise Company (HPE) : Free Stock Analysis Report
General Mills, Inc. (GIS) : Free Stock Analysis Report
Citigroup Inc. (C) : Free Stock Analysis Report
Accenture PLC (ACN) : Free Stock Analysis Report
To read this article on Zacks.com click here.
Zacks Investment Research
