
 Yahoo Finance
 E-mini S&P 500 Index (ES) Futures Technical Analysis – Sustained Move Under 2827.25 Targets 2778.50
September E-mini S&P 500 Index futures closed lower last week, producing a potentially bearish closing price reversal top in the process. Aversion to risk encouraged investors to move their money into safe-haven assets as they reacted to geopolitical turmoil in Turkey and trade dispute tension.
Weekly Swing Chart Technical Analysis
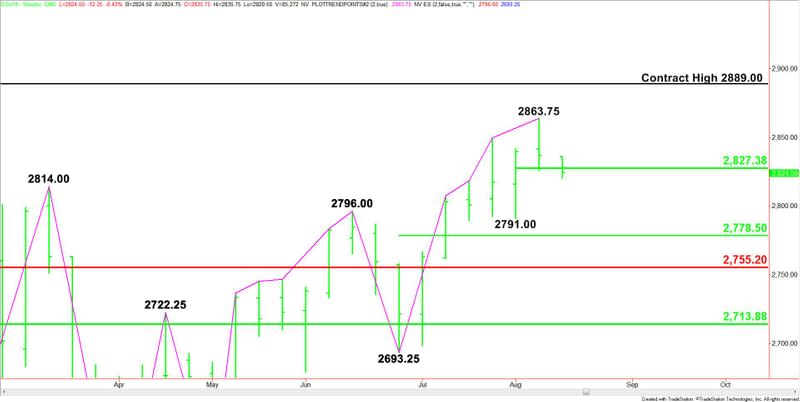
The main trend is up according to the weekly swing chart. A trade through 2863.75 will negate the closing price reversal top and signal a resumption of the uptrend. The main trend changes to down on a trade through 2693.25.
The minor trend is also up. It turns down on a trade through 2791.00.
A closing price reversal top is not a change in trend although it could lead to a 2 to 3 week correction. It usually indicates that the selling is greater than the buying at current price levels.
The minor range is 2791.00 to 2863.75. Its 50% level or pivot is 2827.25. This pivot could control the direction of the index this week.
The main range is 2693.25 to 2863.75. Its retracement zone at 2778.50 to 2758.25 is the first downside target.
The long-term retracement zone at 2755.25 to 2713.50 is major support.
Combining the main range Fib at 2758.25 and the long-term 50% level at 2755.25 creates a key support cluster.
Weekly Swing Chart Technical Forecast
Based on last week’s close at 2836.75, the direction of the September E-mini S&P 500 Index this week is likely to be determined by trader reaction to the pivot at 2827.25.
A sustained move over 2827.25 will indicate the presence of buyers. If this move creates enough upside momentum, we could see a retest of 2863.75.
Taking out 2863.75 will negate the closing price reversal top and signal a resumption of the uptrend. This could trigger a surge into the contract high at 2889.00.
A sustained move under 2827.25 will signal the presence of sellers. The daily chart indicates there is plenty of room to the downside with the next target the minor bottom at 2791.00, followed by the 50% level at 2778.50 and the support cluster at 2758.25 to 2755.25.
This article was originally posted on FX Empire
