
 Yahoo Finance
 E-mini NASDAQ-100 Index (NQ) Futures Technical Analysis – January 24, 2019 Forecast
U.S. technology stocks closed higher on Tuesday on the back of strong gains in the benchmark S&P 500 and the blue chip Dow Jones Industrial Average. Earnings were the driving force behind the gains as investors primarily ignored concerns over U.S.-China trade relations and worries about a global economic slowdown. Technology company, IBM helped boost the Dow with an 8.5 percent gain. Although the stock is not a member of the NASDAQ-100 Index or the NASDAQ Composite, it did help underpin other tech-related shares.
March E-mini NASDAQ-100 Index futures are trading slightly higher on Thursday after posting a 0.12 percent gain the previous session. At 1408 GMT, the index is at 6686.50, up 21.25 or +0.33%.
Daily Swing Chart Technical Analysis
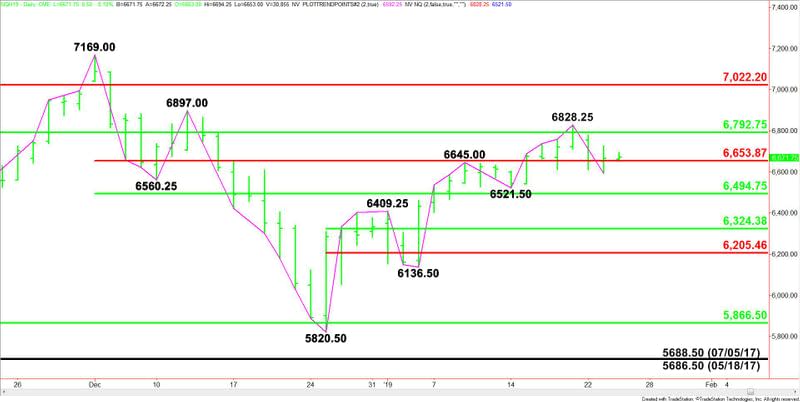
The main trend is up according to the daily swing chart. However, momentum has shifted to the downside. A trade through 6828.25 will signal a resumption of the uptrend. A move through 6521.50 will change the main trend to down.
The minor trend is down. It turned down on Tuesday when sellers took out the minor bottom at 6612.25.
The major range is 7765.00 to 5920.50. Its retracement zone at 6792.75 to 7022.25 is resistance. It is controlling the longer-term direction of the index. It also stopped the rally last week at 6828.25.
The main range is 7169.00 to 5820.50. Its retracement zone at 6653.75 to 6494.75 is the first support zone.
The short-term range is 5820.50 to 6828.25. Its retracement zone at 6324.25 to 6205.50 is the next support zone.
Daily Swing Chart Technical Forecast
Based on last week’s price action and the current price at 6675.50, the direction of the March E-mini NASDAQ-100 Index the rest of the session on Thursday is likely to be determined by trader reaction to the Fibonacci level at 6653.75.
Bullish Scenario
A sustained move over 6653.75 will indicate the presence of buyers. If this move can create enough upside momentum then look for a rally into the major 50% level at 6792.75. This is followed closely by the main top at 6828.25. This is a potential trigger point for an acceleration into the next main top at 6897.00.
Bearish Scenario
A sustained move under 6653.75 will signal the presence of sellers. The daily chart is wide open to the downside under this level, but selling volume will have to increase to drive the index into the nearest downside targets at 6521.50 and 6494.75.
The main trend is down on a trade through 6521.50 so we could see another acceleration to the downside under 6494.75 with the next major target area 6324.25 to 6205.50.
This article was originally posted on FX Empire
