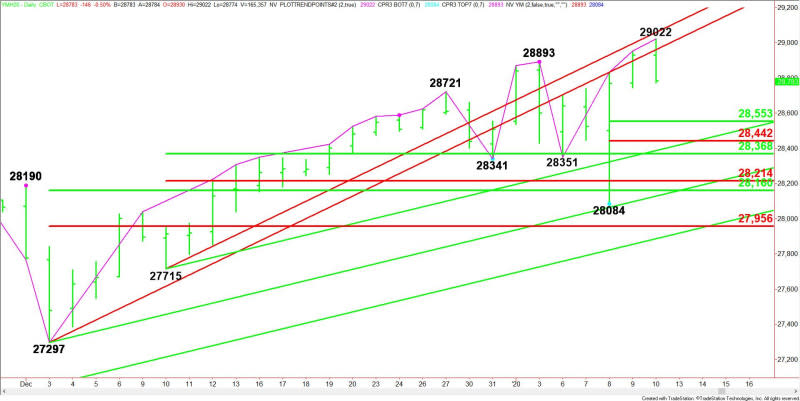
E-mini Dow Jones Industrial Average (YM) Futures Technical Analysis – Reversal Top Forms on Close Under 28929
March E-mini Dow Jones Industrial Average futures reversed from a record high on Friday as investors digested weaker-than-expected jobs data to end a volatile week full of geopolitical concerns. Earlier in the session, the Dow cash and futures crossed above 29,000 for the first time ever.
Profit-taking was most likely behind the selling, but the weakness was also fueled by shares of Boeing, which dropped more than 1% on Friday to lead the Dow lower.
At 21:13 GMT, March E-mini Dow Jones Industrial Average futures are trading 28783, down 146 or -0.50%.

Daily Swing Chart Technical Analysis
The main trend is up according to the daily swing chart. The uptrend was reaffirmed on Friday when buyers took out yesterday’s high. The main trend will change to down on a move through the last main bottom at 28084.
The short-term range is 28084 to 29022. Its retracement zone at 28553 to 28442 is the first downside target zone. Since the main trend is up, buyers are likely to come in on a test of this area.
The intermediate range is 27715 to 29022. Its retracement zone at 28368 to 28214 is the second downside target zone.
The main range is 27297 to 29022. Its retracement zone at 28160 to 27956 is a value zone.
Daily Gann Angle Technical Analysis
On the upside, the uptrending resistance angles came in at 28961 and 29059. Today’s rally stopped between these angles at 29022. If the buying had been strong enough to overcome 29059, this would have put the Dow in an extremely bullish position.
On the downside, the nearest important uptrending Gann angle came in at 28387. It fell between a pair of retracement levels at 28368 to 28442, making it a valid downside target.
Key Chart Pattern
A close under 28929 will form a potentially bearish closing price reversal top. If confirmed on Monday, this could lead to the start of a 2 to 3 day correction with a minimum downside target the 50% level at 28553. This is followed by a Fibonacci level at 28442 and another 50% level at 28368.
This article was originally posted on FX Empire

 Yahoo Finance