
 Yahoo Finance
 E-mini Dow Jones Industrial Average (YM) Futures Technical Analysis – Weakens Under 28449, Strengthens Over 28538
March E-mini Dow Jones Industrial Average futures are trading at their lowest level since January 8 shortly before the regular session opening. The selling is being fueled by worries about the economic impact of China’s spreading coronavirus.
The price action suggests investors are selling first and asking question later because at this time, no one knows the extent of the damage to China’s economy. Furthermore, there are concerns over the coronavirus’ ability to strengthen and spread. Prices could continue to weaken until China markets resume trading next week and the virus outbreak subsides.
At 12:47 GMT, March E-mini Dow Jones Industrial Average futures are at 28529, down 404 or -1.39%.
Daily Technical Analysis
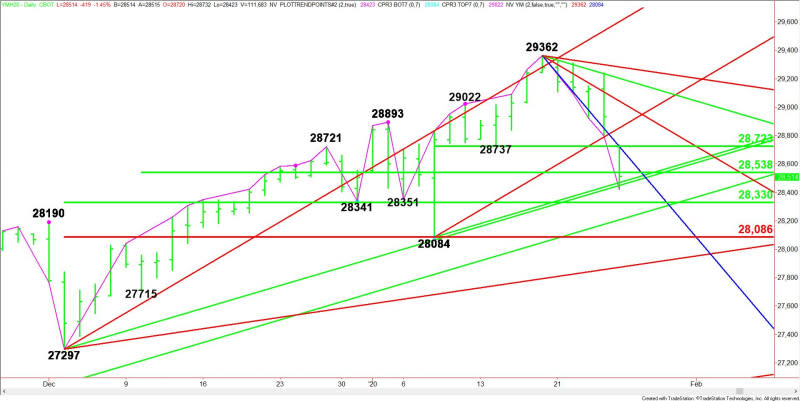
The main trend is up according to the daily swing chart, however, momentum has shifted to the downside. A trade through 28084 will change the main trend to down. A move through 29362 will signal a resumption of the uptrend.
The minor trend is down. This is controlling the momentum.
The short-term range is 28084 to 29362. Its 50% level at 28723 is resistance today.
The intermediate range is 27297 to 29362. The market is currently straddling its 50% level at 28538.
The main range is 27297 to 29362. Its retracement zone at 28330 to 28086 is the primary downside target. Buyers could come in on the first test of this area. Look out to the downside if it fails as support.
Daily Technical Forecast
Based on the early price action and the current price at 28723, the direction of the March E-mini Dow Jones Industrial Average futures contract on Monday is likely to be determined by trader reaction to the uptrending Gann Angle at 28449 and the 50% level at 28538.
Bearish Scenario
A sustained move under 28449 will indicate the presence of sellers. This could trigger a break into the main 50% level at 28330. Look for buyers on the first test of this level. If it fails then look for the selling to possibly extend into an uptrending Gann angle at 28205.
Taking out 28205 will indicate the selling is getting stronger. This could trigger a break into a support cluster at 28086 to 28084.
A failure to hold 28084 is likely to fuel a further break into an uptrending Gann angle at 27873.
Bullish Scenario
Overtaking 28538 will signal the presence of buyers. However, the rally could be limited by a potential resistance cluster at 28722 and 28723. Overtaking 28723 will indicate the buying is getting stronger.
This article was originally posted on FX Empire
