
 Yahoo Finance
 Dynatrace (DT) Q1 Earnings Meet Estimates, Revenues Rise Y/Y
Dynatrace’s DT first-quarter fiscal 2023 adjusted earnings of 18 cents per share were in line with the Zacks Consensus Estimate and increased 12.5% year over year.
Revenues of $267 million beat the consensus mark by 1.72%. The top line improved 27.4% year over year as well. At constant currency (cc), revenues increased 32% year over year.
Top-Line Details
Subscription revenues climbed 27% year over year to $249.6 million. At cc, subscription revenues increased 32% year on year.
Service revenues surged 34.5% from the year-ago quarter to $17.7 million.
Total annual recurring revenues (“ARR”) at the end of the fiscal first quarter increased 25% year over year to $1.03 billion. At cc, ARR jumped 31% year over year.
Dynatrace, Inc. Price, Consensus and EPS Surprise
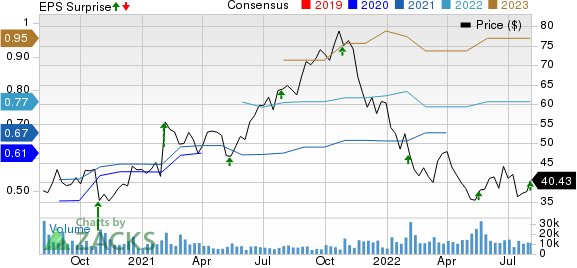
Dynatrace, Inc. price-consensus-eps-surprise-chart | Dynatrace, Inc. Quote
The company’s customer base continued to expand in the reported quarter with 135 new logos added to the Dynatrace platform. Moreover, the net expansion rate remained more than 120% for the 17th consecutive quarter.
Operating Details
Gross margin contracted 100 basis points (bps) year over year to 83.8% in the reported quarter.
Research & development (R&D) expenses flared up 34.9% year on year to $40.6 million. Moreover, as a percentage of revenues, R&D expenses increased 80 bps to 15.2%.
Sales & marketing (S&M) expenses were $94.3 million, up 30.5% year over year. As a percentage of revenues, S&M expenses increased 80 bps to 35.3%.
General & administrative (G&A) expenses went up 31.5% year over year to $28.6 million. As a percentage of revenues, G&A increased 30 bps to 10.7%.
Non-GAAP operating margin contracted 30 bps on a year-over-year basis to 10.7% in the reported quarter.
Balance Sheet & Other Details
As of Jun 30, 2022, Dynatrace had cash and cash equivalents worth $571.3 million.
Long-term debt, as of Jun 30, 2022, was $244.4 million.
The company generated a free cash flow of $136.2 million compared with $80.5 million reported in the year-ago quarter.
Guidance
For second-quarter fiscal 2023, revenues are projected between $272 million and $275 million, suggesting a 20-21% increase year over year (26-28% at cc).
Subscription revenues are estimated between $255 million and $257 million, indicating a 20-21% increase year over year (26-27% at cc).
Non-GAAP operating income is expected between $62 million and $64.5 million suggesting an operating margin in the range of 23-23.5%.
Non-GAAP earnings are anticipated between 18 cents and 19 cents per share.
For fiscal 2023, total ARR is projected between $1.213 billion and $1.226 billion (down from the previously guided range of $1.250-$1.265 billion), indicating a 22-23% year-over-year jump. Unfavorable forex is expected to hurt the top line by $40 million.
Revenues are expected in the range of $1.125-$1.136 billion, suggesting 21-22% year-over-year growth. Unfavorable forex is expected to hurt the top line by $47 million.
Subscription revenues are estimated in the range of $1.053-$1.062 billion, indicating 21-22% growth.
Non-GAAP operating income is envisioned between $252 million and $261 million.
Moreover, non-GAAP earnings are anticipated between 73 cents and 76 cents per share (down from the previously guided range of 74-77 cents per share).
Further, free cash flow is now expected in the band of $310-$325 million.
Zacks Rank & Stocks to Consider
Dynatrace currently carries a Zacks Rank #3 (Hold).
Asure Software ASUR, Blink Charging BLNK, and Everbridge EVBG are some better-ranked stocks that investors can consider in the broader sector. All three stocks have a Zacks Rank #2 (Buy). You can see the complete list of today’s Zacks #1 Rank (Strong Buy) stocks here.
Asure shares are down 32.6% year to date. ASUR is set to report second-quarter 2022 results on Aug 8.
Blink shares are up 16.8% year to date. BLNK is set to report second-quarter 2022 results on Aug 8.
Everbridge shares are down 51.5% year to date. EVBG is set to report second-quarter 2022 results on Aug 9.
Want the latest recommendations from Zacks Investment Research? Today, you can download 7 Best Stocks for the Next 30 Days. Click to get this free report
Asure Software Inc (ASUR) : Free Stock Analysis Report
Dynatrace, Inc. (DT) : Free Stock Analysis Report
Everbridge, Inc. (EVBG) : Free Stock Analysis Report
Blink Charging Co. (BLNK) : Free Stock Analysis Report
To read this article on Zacks.com click here.
Zacks Investment Research
