
 Yahoo Finance
 Dr. Martens (LON:DOCS) Is Very Good At Capital Allocation
What trends should we look for it we want to identify stocks that can multiply in value over the long term? Ideally, a business will show two trends; firstly a growing return on capital employed (ROCE) and secondly, an increasing amount of capital employed. Ultimately, this demonstrates that it's a business that is reinvesting profits at increasing rates of return. With that in mind, the ROCE of Dr. Martens (LON:DOCS) looks great, so lets see what the trend can tell us.
What Is Return On Capital Employed (ROCE)?
Just to clarify if you're unsure, ROCE is a metric for evaluating how much pre-tax income (in percentage terms) a company earns on the capital invested in its business. To calculate this metric for Dr. Martens, this is the formula:
Return on Capital Employed = Earnings Before Interest and Tax (EBIT) ÷ (Total Assets - Current Liabilities)
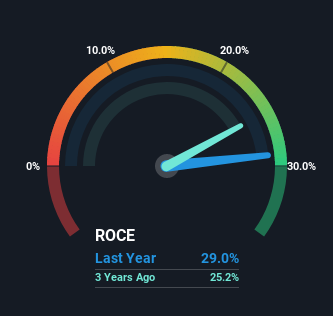
0.29 = UK£221m ÷ (UK£981m - UK£219m) (Based on the trailing twelve months to September 2022).
Therefore, Dr. Martens has an ROCE of 29%. In absolute terms that's a great return and it's even better than the Luxury industry average of 10%.
See our latest analysis for Dr. Martens
In the above chart we have measured Dr. Martens' prior ROCE against its prior performance, but the future is arguably more important. If you're interested, you can view the analysts predictions in our free report on analyst forecasts for the company.
What Does the ROCE Trend For Dr. Martens Tell Us?
Dr. Martens is displaying some positive trends. The numbers show that in the last five years, the returns generated on capital employed have grown considerably to 29%. The amount of capital employed has increased too, by 100%. This can indicate that there's plenty of opportunities to invest capital internally and at ever higher rates, a combination that's common among multi-baggers.
On a side note, we noticed that the improvement in ROCE appears to be partly fueled by an increase in current liabilities. Essentially the business now has suppliers or short-term creditors funding about 22% of its operations, which isn't ideal. Keep an eye out for future increases because when the ratio of current liabilities to total assets gets particularly high, this can introduce some new risks for the business.
Our Take On Dr. Martens' ROCE
To sum it up, Dr. Martens has proven it can reinvest in the business and generate higher returns on that capital employed, which is terrific. And since the stock has fallen 26% over the last year, there might be an opportunity here. With that in mind, we believe the promising trends warrant this stock for further investigation.
One more thing to note, we've identified 2 warning signs with Dr. Martens and understanding these should be part of your investment process.
High returns are a key ingredient to strong performance, so check out our free list ofstocks earning high returns on equity with solid balance sheets.
Have feedback on this article? Concerned about the content? Get in touch with us directly. Alternatively, email editorial-team (at) simplywallst.com.
This article by Simply Wall St is general in nature. We provide commentary based on historical data and analyst forecasts only using an unbiased methodology and our articles are not intended to be financial advice. It does not constitute a recommendation to buy or sell any stock, and does not take account of your objectives, or your financial situation. We aim to bring you long-term focused analysis driven by fundamental data. Note that our analysis may not factor in the latest price-sensitive company announcements or qualitative material. Simply Wall St has no position in any stocks mentioned.
Join A Paid User Research Session
You’ll receive a US$30 Amazon Gift card for 1 hour of your time while helping us build better investing tools for the individual investors like yourself. Sign up here
