
 Yahoo Finance
 Dr Martens bosses and backers set for huge windfall in £3.5bn float
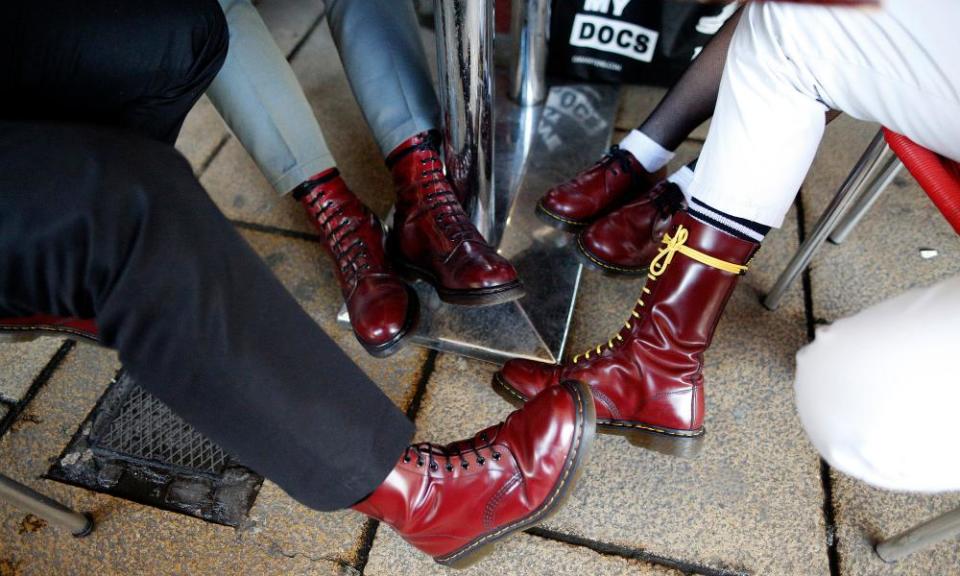
The British footwear brand Dr Martens is expected to launch a stock market flotation on Monday that would value the Northamptonshire firm at £3.5bn and generate a huge windfall for its bosses and backers.
The company, known for its boots with chunky air-cushioned soles and distinctive yellow stitching, was owned until 2013 by the Griggs family, who sold to the private equity investment group Permira for £300m but retained a near-10% stake. Just seven years later the business has soared in value and when it lands on the stock market will create numerous multimillionaires.
If the float proceeds successfully it should result in a £350m payout for 22 senior staff. They include the chief executive, Kenny Wilson, who only joined the company two years ago and is in line for a stake worth £58m. He previously worked for Cath Kidston, which collapsed last year. The chairman, Paul Mason, who was once chief executive of Asda, will also receive a multimillion-pound windfall.
A group of former Dr Martens staff will receive shares worth £150m between them, while about 2,200 more junior employees are expected to get cash bonuses.
Senior executives at Permira are also likely to get a big payout. As a result of their fees and bonuses they will share a pool of cash that, according to Peter Morris, an associate scholar at Saïd Business School in Oxford, is likely to be worth £485m if the company is valued at £3.5bn.
Richard Hyman, a partner at the retail consultancy TPC, said: “It’s a hell of a lot of money. You are paying for growth well into the future when the future has never been so uncertain.” He said Wilson’s credentials as a “really good leader and retailer” justified the valuation in part.
Maureen Hinton, a global retail analyst at the data firm Global Data, said: “Dr Martens are riding on a fashion wave. On Instagram you see many influencers wearing it. If you are all sat at home, you are looking more at social media … Younger people do go out and it appeals to a younger age group.”
She said that Dr Martens had a big global opportunity, especially among wealthy young people in the Asia-Pacific region.
The Griggs family’s 10% stake will be worth £330m.
The first pair of UK-made Dr Martens boots were produced in 1960. Sales of the classic 1460 and other Dr Martens boots have boomed in recent years, rising from £160m in 2013 to £672m in the year to March 2020.
Dr Martens, which now sells 11m pairs of shoes and boots a year across more than 60 countries, has managed to weather the Covid-19 pandemic well, despite lockdowns that forced its 130 high street stores to shut. Saes rose 18% to £318m in the six months to September while profits grew by a third to £86.3m. The majority of sales come from its wholesale business, which sells to retailers.
The footwear brand began as a collaboration between a small shoe factory in Northamptonshire and two doctors in Munich, one of whom, Dr Klaus Märtens had developed an air-cushioned chunky sole in 1947 after a foot operation following a skiing accident. The shoe-making Griggs family acquired the licence and designed the 1460 in April 1960 (hence the name).
The boots grew in popularity after being adopted by skinheads in the 1960s, and later became fashion staples among punks and goths. More recently chunky boots have become mainstream fashion, with themodel turned actor Agyness Deyn and the singer Rihanna among wearers.
The Dr Martens share sale is one of a number of of stock market listings being lined up as owners seek to cash in on buoyant stock markets. London investment banks are also lining up public listings of Deliveroo, the online gifts and cards group Moonpig and the online review site Trustpilot.
