
 Yahoo Finance
 Don't Sell The TJX Companies, Inc. (NYSE:TJX) Before You Read This

Want to participate in a short research study? Help shape the future of investing tools and you could win a $250 gift card!
This article is written for those who want to get better at using price to earnings ratios (P/E ratios). We'll show how you can use The TJX Companies, Inc.'s (NYSE:TJX) P/E ratio to inform your assessment of the investment opportunity. Looking at earnings over the last twelve months, TJX Companies has a P/E ratio of 22.6. That is equivalent to an earnings yield of about 4.4%.
See our latest analysis for TJX Companies
How Do You Calculate TJX Companies's P/E Ratio?
The formula for P/E is:
Price to Earnings Ratio = Price per Share ÷ Earnings per Share (EPS)
Or for TJX Companies:
P/E of 22.6 = $55.86 ÷ $2.47 (Based on the trailing twelve months to May 2019.)
Is A High Price-to-Earnings Ratio Good?
The higher the P/E ratio, the higher the price tag of a business, relative to its trailing earnings. That is not a good or a bad thing per se, but a high P/E does imply buyers are optimistic about the future.
Does TJX Companies Have A Relatively High Or Low P/E For Its Industry?
One good way to get a quick read on what market participants expect of a company is to look at its P/E ratio. The image below shows that TJX Companies has a higher P/E than the average (15.2) P/E for companies in the specialty retail industry.
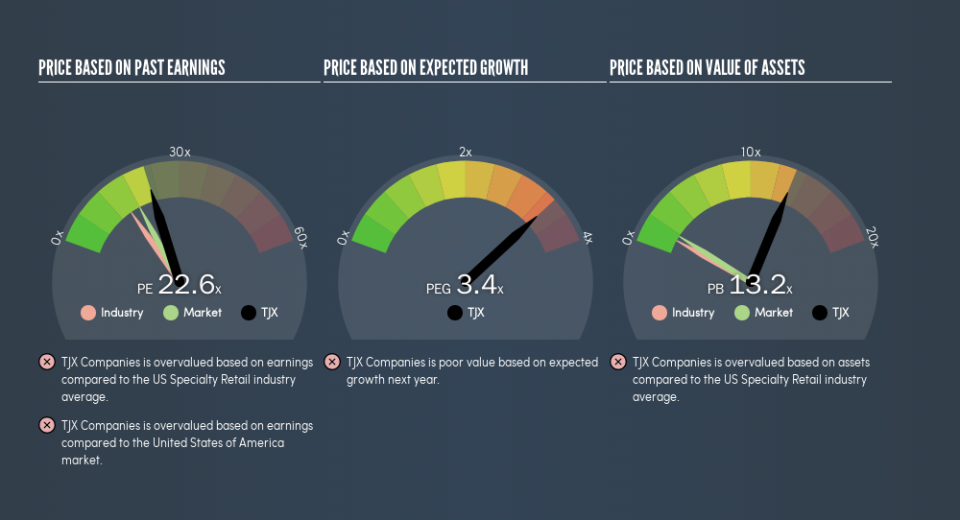
That means that the market expects TJX Companies will outperform other companies in its industry. Shareholders are clearly optimistic, but the future is always uncertain. So further research is always essential. I often monitor director buying and selling.
How Growth Rates Impact P/E Ratios
Earnings growth rates have a big influence on P/E ratios. When earnings grow, the 'E' increases, over time. That means even if the current P/E is high, it will reduce over time if the share price stays flat. And as that P/E ratio drops, the company will look cheap, unless its share price increases.
TJX Companies increased earnings per share by an impressive 12% over the last twelve months. And earnings per share have improved by 10% annually, over the last five years. So one might expect an above average P/E ratio.
Don't Forget: The P/E Does Not Account For Debt or Bank Deposits
It's important to note that the P/E ratio considers the market capitalization, not the enterprise value. So it won't reflect the advantage of cash, or disadvantage of debt. Hypothetically, a company could reduce its future P/E ratio by spending its cash (or taking on debt) to achieve higher earnings.
While growth expenditure doesn't always pay off, the point is that it is a good option to have; but one that the P/E ratio ignores.
TJX Companies's Balance Sheet
The extra options and safety that comes with TJX Companies's US$688k net cash position means that it deserves a higher P/E than it would if it had a lot of net debt.
The Verdict On TJX Companies's P/E Ratio
TJX Companies's P/E is 22.6 which is above average (17.9) in its market. Its net cash position supports a higher P/E ratio, as does its solid recent earnings growth. Therefore it seems reasonable that the market would have relatively high expectations of the company
Investors should be looking to buy stocks that the market is wrong about. If the reality for a company is better than it expects, you can make money by buying and holding for the long term. So this free visualization of the analyst consensus on future earnings could help you make the right decision about whether to buy, sell, or hold.
You might be able to find a better buy than TJX Companies. If you want a selection of possible winners, check out this free list of interesting companies that trade on a P/E below 20 (but have proven they can grow earnings).
We aim to bring you long-term focused research analysis driven by fundamental data. Note that our analysis may not factor in the latest price-sensitive company announcements or qualitative material.
If you spot an error that warrants correction, please contact the editor at editorial-team@simplywallst.com. This article by Simply Wall St is general in nature. It does not constitute a recommendation to buy or sell any stock, and does not take account of your objectives, or your financial situation. Simply Wall St has no position in the stocks mentioned. Thank you for reading.
