
 Yahoo Finance
 Don't Sell Diversified Royalty Corp. (TSE:DIV) Before You Read This

The goal of this article is to teach you how to use price to earnings ratios (P/E ratios). To keep it practical, we'll show how Diversified Royalty Corp.'s (TSE:DIV) P/E ratio could help you assess the value on offer. What is Diversified Royalty's P/E ratio? Well, based on the last twelve months it is 28.17. In other words, at today's prices, investors are paying CA$28.17 for every CA$1 in prior year profit.
See our latest analysis for Diversified Royalty
How Do I Calculate A Price To Earnings Ratio?
The formula for P/E is:
Price to Earnings Ratio = Share Price ÷ Earnings per Share (EPS)
Or for Diversified Royalty:
P/E of 28.17 = CA$2.71 ÷ CA$0.096 (Based on the trailing twelve months to June 2019.)
Is A High P/E Ratio Good?
A higher P/E ratio implies that investors pay a higher price for the earning power of the business. That is not a good or a bad thing per se, but a high P/E does imply buyers are optimistic about the future.
How Does Diversified Royalty's P/E Ratio Compare To Its Peers?
We can get an indication of market expectations by looking at the P/E ratio. You can see in the image below that the average P/E (21.5) for companies in the hospitality industry is lower than Diversified Royalty's P/E.
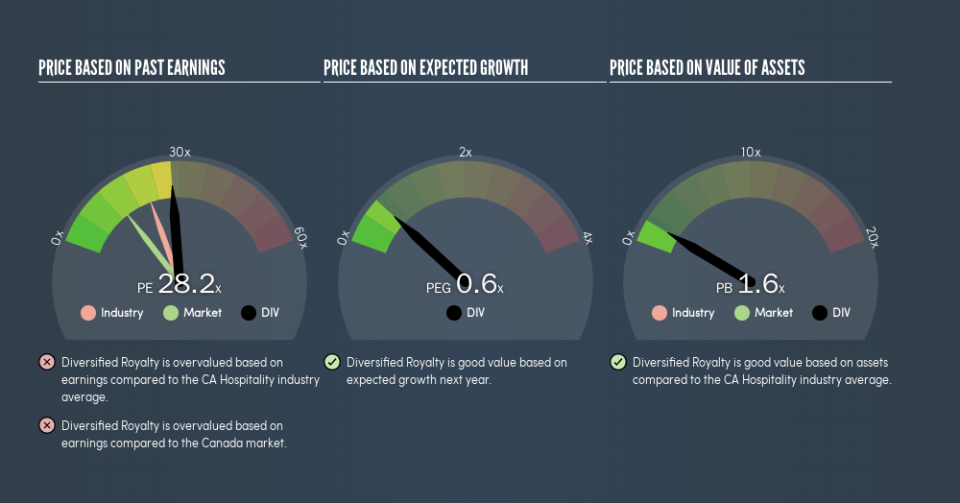
Diversified Royalty's P/E tells us that market participants think the company will perform better than its industry peers, going forward. Shareholders are clearly optimistic, but the future is always uncertain. So investors should delve deeper. I like to check if company insiders have been buying or selling.
How Growth Rates Impact P/E Ratios
Probably the most important factor in determining what P/E a company trades on is the earnings growth. That's because companies that grow earnings per share quickly will rapidly increase the 'E' in the equation. Therefore, even if you pay a high multiple of earnings now, that multiple will become lower in the future. So while a stock may look expensive based on past earnings, it could be cheap based on future earnings.
Diversified Royalty shrunk earnings per share by 16% over the last year. But EPS is up 1.6% over the last 3 years.
Don't Forget: The P/E Does Not Account For Debt or Bank Deposits
One drawback of using a P/E ratio is that it considers market capitalization, but not the balance sheet. In other words, it does not consider any debt or cash that the company may have on the balance sheet. Theoretically, a business can improve its earnings (and produce a lower P/E in the future) by investing in growth. That means taking on debt (or spending its cash).
Spending on growth might be good or bad a few years later, but the point is that the P/E ratio does not account for the option (or lack thereof).
Is Debt Impacting Diversified Royalty's P/E?
Net debt is 29% of Diversified Royalty's market cap. While that's enough to warrant consideration, it doesn't really concern us.
The Bottom Line On Diversified Royalty's P/E Ratio
Diversified Royalty's P/E is 28.2 which is above average (13.9) in its market. With some debt but no EPS growth last year, the market has high expectations of future profits.
Investors have an opportunity when market expectations about a stock are wrong. If the reality for a company is better than it expects, you can make money by buying and holding for the long term. So this free visual report on analyst forecasts could hold the key to an excellent investment decision.
Of course, you might find a fantastic investment by looking at a few good candidates. So take a peek at this free list of companies with modest (or no) debt, trading on a P/E below 20.
We aim to bring you long-term focused research analysis driven by fundamental data. Note that our analysis may not factor in the latest price-sensitive company announcements or qualitative material.
If you spot an error that warrants correction, please contact the editor at editorial-team@simplywallst.com. This article by Simply Wall St is general in nature. It does not constitute a recommendation to buy or sell any stock, and does not take account of your objectives, or your financial situation. Simply Wall St has no position in the stocks mentioned. Thank you for reading.
