
 Yahoo Finance
 Don't Sell CME Group Inc. (NASDAQ:CME) Before You Read This

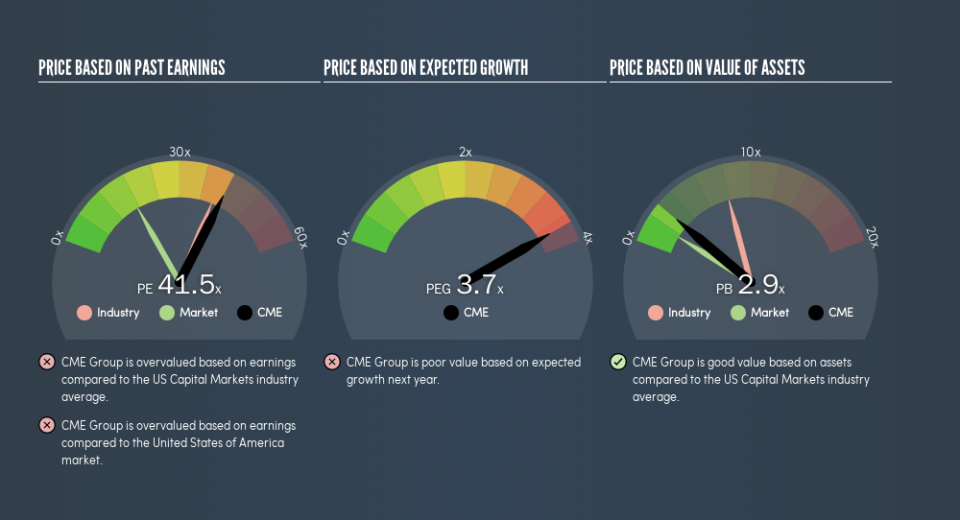
Today, we'll introduce the concept of the P/E ratio for those who are learning about investing. To keep it practical, we'll show how CME Group Inc.'s (NASDAQ:CME) P/E ratio could help you assess the value on offer. What is CME Group's P/E ratio? Well, based on the last twelve months it is 41.53. In other words, at today's prices, investors are paying $41.53 for every $1 in prior year profit.
View our latest analysis for CME Group
How Do I Calculate CME Group's Price To Earnings Ratio?
The formula for P/E is:
Price to Earnings Ratio = Price per Share ÷ Earnings per Share (EPS)
Or for CME Group:
P/E of 41.53 = $213.85 ÷ $5.15 (Based on the year to June 2019.)
Is A High P/E Ratio Good?
A higher P/E ratio means that buyers have to pay a higher price for each $1 the company has earned over the last year. That isn't necessarily good or bad, but a high P/E implies relatively high expectations of what a company can achieve in the future.
How Does CME Group's P/E Ratio Compare To Its Peers?
One good way to get a quick read on what market participants expect of a company is to look at its P/E ratio. You can see in the image below that the average P/E (39.3) for companies in the capital markets industry is roughly the same as CME Group's P/E.
Its P/E ratio suggests that CME Group shareholders think that in the future it will perform about the same as other companies in its industry classification. If the company has better than average prospects, then the market might be underestimating it. Checking factors such as director buying and selling. could help you form your own view on if that will happen.
How Growth Rates Impact P/E Ratios
Probably the most important factor in determining what P/E a company trades on is the earnings growth. When earnings grow, the 'E' increases, over time. That means even if the current P/E is high, it will reduce over time if the share price stays flat. And as that P/E ratio drops, the company will look cheap, unless its share price increases.
CME Group shrunk earnings per share by 60% over the last year. But over the longer term (5 years) earnings per share have increased by 12%.
A Limitation: P/E Ratios Ignore Debt and Cash In The Bank
It's important to note that the P/E ratio considers the market capitalization, not the enterprise value. In other words, it does not consider any debt or cash that the company may have on the balance sheet. Theoretically, a business can improve its earnings (and produce a lower P/E in the future) by investing in growth. That means taking on debt (or spending its cash).
Spending on growth might be good or bad a few years later, but the point is that the P/E ratio does not account for the option (or lack thereof).
CME Group's Balance Sheet
CME Group's net debt is 4.0% of its market cap. It would probably trade on a higher P/E ratio if it had a lot of cash, but I doubt it is having a big impact.
The Verdict On CME Group's P/E Ratio
CME Group trades on a P/E ratio of 41.5, which is above its market average of 17.3. With some debt but no EPS growth last year, the market has high expectations of future profits.
Investors have an opportunity when market expectations about a stock are wrong. If the reality for a company is better than it expects, you can make money by buying and holding for the long term. So this free visualization of the analyst consensus on future earnings could help you make the right decision about whether to buy, sell, or hold.
But note: CME Group may not be the best stock to buy. So take a peek at this free list of interesting companies with strong recent earnings growth (and a P/E ratio below 20).
We aim to bring you long-term focused research analysis driven by fundamental data. Note that our analysis may not factor in the latest price-sensitive company announcements or qualitative material.
If you spot an error that warrants correction, please contact the editor at editorial-team@simplywallst.com. This article by Simply Wall St is general in nature. It does not constitute a recommendation to buy or sell any stock, and does not take account of your objectives, or your financial situation. Simply Wall St has no position in the stocks mentioned. Thank you for reading.
