
 Yahoo Finance
 Don’t Sell Newpark Resources, Inc. (NYSE:NR) Before You Read This

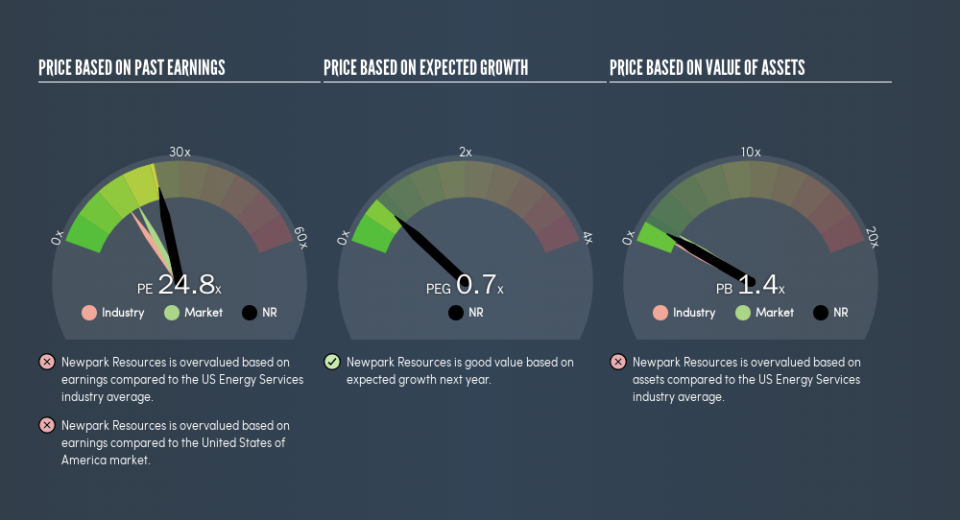
This article is written for those who want to get better at using price to earnings ratios (P/E ratios). We’ll look at Newpark Resources, Inc.’s (NYSE:NR) P/E ratio and reflect on what it tells us about the company’s share price. Based on the last twelve months, Newpark Resources’s P/E ratio is 24.78. That corresponds to an earnings yield of approximately 4.0%.
Check out our latest analysis for Newpark Resources
How Do You Calculate A P/E Ratio?
The formula for P/E is:
Price to Earnings Ratio = Price per Share ÷ Earnings per Share (EPS)
Or for Newpark Resources:
P/E of 24.78 = $8.89 ÷ $0.36 (Based on the year to December 2018.)
Is A High Price-to-Earnings Ratio Good?
A higher P/E ratio means that investors are paying a higher price for each $1 of company earnings. That isn’t necessarily good or bad, but a high P/E implies relatively high expectations of what a company can achieve in the future.
How Growth Rates Impact P/E Ratios
Earnings growth rates have a big influence on P/E ratios. Earnings growth means that in the future the ‘E’ will be higher. That means even if the current P/E is high, it will reduce over time if the share price stays flat. Then, a lower P/E should attract more buyers, pushing the share price up.
It’s nice to see that Newpark Resources grew EPS by a stonking 173% in the last year. And its annual EPS growth rate over 3 years is 114%. So we’d generally expect it to have a relatively high P/E ratio. But earnings per share are down 20% per year over the last five years.
How Does Newpark Resources’s P/E Ratio Compare To Its Peers?
We can get an indication of market expectations by looking at the P/E ratio. As you can see below, Newpark Resources has a higher P/E than the average company (15.2) in the energy services industry.
Its relatively high P/E ratio indicates that Newpark Resources shareholders think it will perform better than other companies in its industry classification. Clearly the market expects growth, but it isn’t guaranteed. So investors should delve deeper. I like to check if company insiders have been buying or selling.
Remember: P/E Ratios Don’t Consider The Balance Sheet
It’s important to note that the P/E ratio considers the market capitalization, not the enterprise value. In other words, it does not consider any debt or cash that the company may have on the balance sheet. Hypothetically, a company could reduce its future P/E ratio by spending its cash (or taking on debt) to achieve higher earnings.
Such expenditure might be good or bad, in the long term, but the point here is that the balance sheet is not reflected by this ratio.
Newpark Resources’s Balance Sheet
Net debt totals 13% of Newpark Resources’s market cap. It would probably deserve a higher P/E ratio if it was net cash, since it would have more options for growth.
The Bottom Line On Newpark Resources’s P/E Ratio
Newpark Resources trades on a P/E ratio of 24.8, which is above the US market average of 17.8. The company is not overly constrained by its modest debt levels, and it is growing earnings per share. So it does not seem strange that the P/E is above average.
When the market is wrong about a stock, it gives savvy investors an opportunity. As value investor Benjamin Graham famously said, ‘In the short run, the market is a voting machine but in the long run, it is a weighing machine.’ So this free visualization of the analyst consensus on future earnings could help you make the right decision about whether to buy, sell, or hold.
Of course you might be able to find a better stock than Newpark Resources. So you may wish to see this free collection of other companies that have grown earnings strongly.
We aim to bring you long-term focused research analysis driven by fundamental data. Note that our analysis may not factor in the latest price-sensitive company announcements or qualitative material.
If you spot an error that warrants correction, please contact the editor at editorial-team@simplywallst.com. This article by Simply Wall St is general in nature. It does not constitute a recommendation to buy or sell any stock, and does not take account of your objectives, or your financial situation. Simply Wall St has no position in the stocks mentioned. Thank you for reading.
