
 Yahoo Finance
 Is Dollarama Inc (TSE:DOL) Attractive At Its Current PE Ratio?

The content of this article will benefit those of you who are starting to educate yourself about investing in the stock market and want to learn about the link between company’s fundamentals and stock market performance.
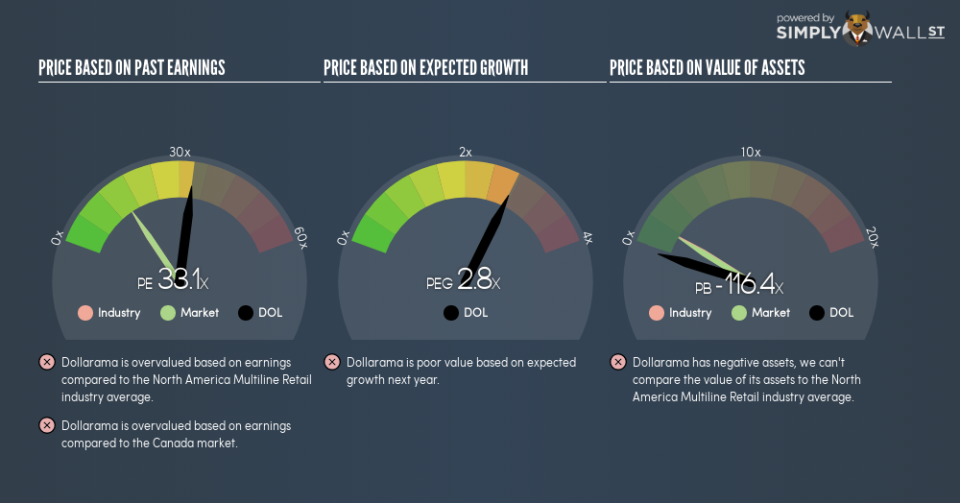
Dollarama Inc (TSE:DOL) is trading with a trailing P/E of 33.1, which is higher than the industry average of 15.4. While this might not seem positive, it is important to understand the assumptions behind the P/E ratio before you make any investment decisions. In this article, I will deconstruct the P/E ratio and highlight what you need to be careful of when using the P/E ratio.
See our latest analysis for Dollarama
What you need to know about the P/E ratio
The P/E ratio is a popular ratio used in relative valuation since earnings power is a key driver of investment value. By comparing a stock’s price per share to its earnings per share, we are able to see how much investors are paying for each dollar of the company’s earnings.
P/E Calculation for DOL
Price-Earnings Ratio = Price per share ÷ Earnings per share
DOL Price-Earnings Ratio = CA$52.07 ÷ CA$1.574 = 33.1x
On its own, the P/E ratio doesn’t tell you much; however, it becomes extremely useful when you compare it with other similar companies. Our goal is to compare the stock’s P/E ratio to the average of companies that have similar attributes to DOL, such as company lifetime and products sold. A common peer group is companies that exist in the same industry, which is what I use. At 33.1, DOL’s P/E is higher than its industry peers (15.4). This implies that investors are overvaluing each dollar of DOL’s earnings. Since the Multiline Retail sector in CA is relatively small, I’ve included similar companies in the wider region in order to get a better idea of the multiple, which is a median of profitable companies of companies such as Canadian Tire, and . You could also say that the market is suggesting that DOL is a stronger business than the average comparable company.
A few caveats
However, it is important to note that our examination of the stock is based on certain assumptions. Firstly, that our peer group contains companies that are similar to DOL. If this isn’t the case, the difference in P/E could be due to other factors. For example, if Dollarama Inc is growing faster than its peers, then it would deserve a higher P/E ratio. Of course, it is possible that the stocks we are comparing with DOL are not fairly valued. Thus while we might conclude that it is richly valued relative to its peers, that could be explained by the peer group being undervalued.
What this means for you:
If your personal research into the stock confirms what the P/E ratio is telling you, it might be a good time to rebalance your portfolio and reduce your holdings in DOL. But keep in mind that the usefulness of relative valuation depends on whether you are comfortable with making the assumptions I mentioned above. Remember that basing your investment decision off one metric alone is certainly not sufficient. There are many things I have not taken into account in this article and the PE ratio is very one-dimensional. If you have not done so already, I urge you to complete your research by taking a look at the following:
Future Outlook: What are well-informed industry analysts predicting for DOL’s future growth? Take a look at our free research report of analyst consensus for DOL’s outlook.
Past Track Record: Has DOL been consistently performing well irrespective of the ups and downs in the market? Go into more detail in the past performance analysis and take a look at the free visual representations of DOL’s historicals for more clarity.
Other High-Performing Stocks: Are there other stocks that provide better prospects with proven track records? Explore our free list of these great stocks here.
To help readers see past the short term volatility of the financial market, we aim to bring you a long-term focused research analysis purely driven by fundamental data. Note that our analysis does not factor in the latest price-sensitive company announcements.
The author is an independent contributor and at the time of publication had no position in the stocks mentioned. For errors that warrant correction please contact the editor at editorial-team@simplywallst.com.
