
 Yahoo Finance
 Does Verint Systems Inc’s (NASDAQ:VRNT) Debt Level Pose A Problem?

Small-caps and large-caps are wildly popular among investors; however, mid-cap stocks, such as Verint Systems Inc (NASDAQ:VRNT) with a market-capitalization of US$3.12b, rarely draw their attention. Surprisingly though, when accounted for risk, mid-caps have delivered better returns compared to the two other categories of stocks. VRNT’s financial liquidity and debt position will be analysed in this article, to get an idea of whether the company can fund opportunities for strategic growth and maintain strength through economic downturns. Don’t forget that this is a general and concentrated examination of Verint Systems’s financial health, so you should conduct further analysis into VRNT here.
View our latest analysis for Verint Systems
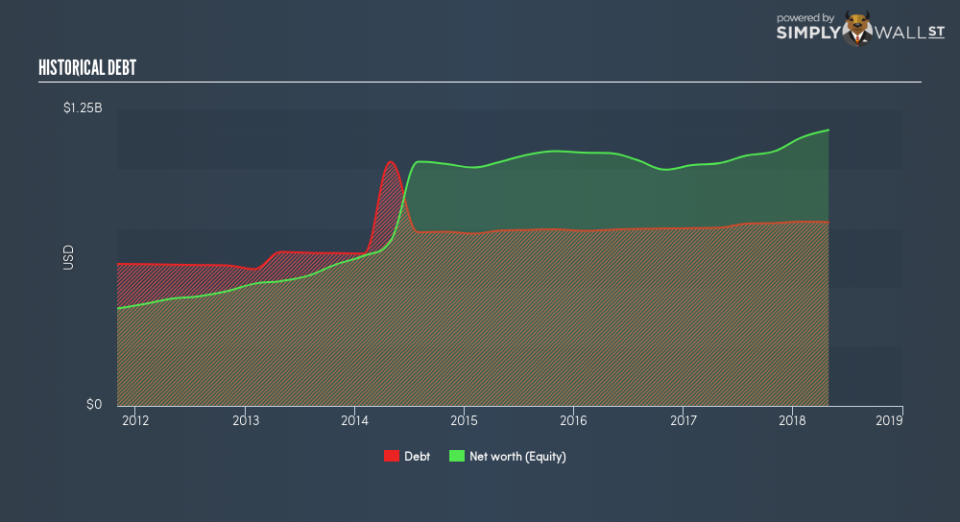
How does VRNT’s operating cash flow stack up against its debt?
VRNT has sustained its debt level by about US$775.2m over the last 12 months made up of current and long term debt. At this current level of debt, the current cash and short-term investment levels stands at US$393.2m for investing into the business. Additionally, VRNT has produced US$176.7m in operating cash flow over the same time period, leading to an operating cash to total debt ratio of 22.8%, meaning that VRNT’s operating cash is sufficient to cover its debt. This ratio can also be a sign of operational efficiency as an alternative to return on assets. In VRNT’s case, it is able to generate 0.23x cash from its debt capital.
Can VRNT pay its short-term liabilities?
At the current liabilities level of US$602.2m liabilities, it appears that the company has been able to meet these commitments with a current assets level of US$919.0m, leading to a 1.53x current account ratio. Generally, for Software companies, this is a reasonable ratio since there is a bit of a cash buffer without leaving too much capital in a low-return environment.
Can VRNT service its debt comfortably?
VRNT is a relatively highly levered company with a debt-to-equity of 66.6%. This is not uncommon for a mid-cap company given that debt tends to be lower-cost and at times, more accessible. We can test if VRNT’s debt levels are sustainable by measuring interest payments against earnings of a company. Ideally, earnings before interest and tax (EBIT) should cover net interest by at least three times. For VRNT, the ratio of 2.15x suggests that interest is not strongly covered, which means that debtors may be less inclined to loan the company more money, reducing its headroom for growth through debt.
Next Steps:
At its current level of cash flow coverage, VRNT has room for improvement to better cushion for events which may require debt repayment. However, the company exhibits an ability to meet its near term obligations should an adverse event occur. I admit this is a fairly basic analysis for VRNT’s financial health. Other important fundamentals need to be considered alongside. I recommend you continue to research Verint Systems to get a more holistic view of the stock by looking at:
Future Outlook: What are well-informed industry analysts predicting for VRNT’s future growth? Take a look at our free research report of analyst consensus for VRNT’s outlook.
Valuation: What is VRNT worth today? Is the stock undervalued, even when its growth outlook is factored into its intrinsic value? The intrinsic value infographic in our free research report helps visualize whether VRNT is currently mispriced by the market.
Other High-Performing Stocks: Are there other stocks that provide better prospects with proven track records? Explore our free list of these great stocks here.
To help readers see past the short term volatility of the financial market, we aim to bring you a long-term focused research analysis purely driven by fundamental data. Note that our analysis does not factor in the latest price-sensitive company announcements.
The author is an independent contributor and at the time of publication had no position in the stocks mentioned. For errors that warrant correction please contact the editor at editorial-team@simplywallst.com.
