
 Yahoo Finance
 Does Unico American Corporation’s (NASDAQ:UNAM) CEO Pay Compare Well With Peers?

Cary Cheldin is the CEO of Unico American Corporation (NASDAQ:UNAM), which has recently grown to a market capitalization of US$45.11M. Recognizing whether CEO incentives are aligned with shareholders is a crucial part of investing. This is because, if incentives are aligned, more value is created for shareholders which directly impacts your returns as an investor. Today we will assess Cheldin’s pay and compare this to the company’s performance over the same period, as well as measure it against other US CEOs leading companies of similar size and profitability. View our latest analysis for Unico American
Did Cheldin create value?
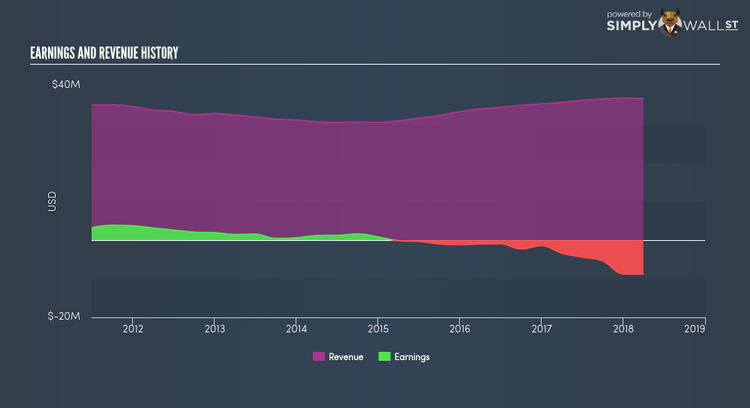
Earnings is a powerful indication of UNAM’s ability to invest shareholders’ funds and generate returns. Therefore I will use earnings as a proxy of Cheldin’s performance in the past year. Recently, UNAM delivered negative earnings of -US$8.78M , which is a further decline from prior year’s loss of -US$3.35M. Additionally, on average, UNAM has been loss-making in the past, with a 5-year average EPS of -US$0.064. During times of negative earnings, the company may be going through a period of reinvestment and growth, or it can be a sign of some headwind. In any event, CEO compensation should emulate the current state of the business. In the latest financial statments, Cheldin’s total compensation grew by 5.27% to US$379.43K. Although I couldn’t find information on the composition of Cheldin’s pay, if some portion were non-cash items such as stocks and options, then fluctuations in UNAM’s share price can move the actual level of what the CEO actually collects at the end of the year.
Is UNAM overpaying the CEO?
While there is no cookie-cutter approach, since compensation should account for specific factors of the company and market, we can evaluate a high-level benchmark to see if UNAM is an outlier. This exercise can help direct shareholders to ask the right question about Cheldin’s incentive alignment. Normally, a US small-cap is worth around $1B, generates earnings of $96M, and remunerates its CEO circa $2.7M per year. Normally I would use earnings and market cap to account for variations in performance, however, UNAM’s negative earnings reduces the effectiveness of this method. Looking at the range of compensation for small-cap executives, it seems like Cheldin is being paid within the bounds of reasonableness. Overall, even though UNAM is unprofitable, it seems like the CEO’s pay is reflective of the appropriate level.
Next Steps:
CEO pay is one of those topics of high controversy. Nonetheless, it should be talked about with full transparency from the board to shareholders. Is Cheldin remunerated appropriately based on other factors we have not covered today? Is this justified? As a shareholder, you should be aware of how those that represent you (i.e. the board of directors) make decisions on CEO pay and whether their incentives are aligned with yours. If you have not done so already, I highly recommend you to complete your research by taking a look at the following:
Governance: To find out more about UNAM’s governance, look through our infographic report of the company’s board and management.
Financial Health: Does it have a healthy balance sheet? Take a look at our free balance sheet analysis with six simple checks on key factors like leverage and risk.
Other High-Growth Alternatives: Are there other high-growth stocks you could be holding instead of UNAM? Explore our interactive list of stocks with large growth potential to get an idea of what else is out there you may be missing!
To help readers see pass the short term volatility of the financial market, we aim to bring you a long-term focused research analysis purely driven by fundamental data. Note that our analysis does not factor in the latest price sensitive company announcements.
The author is an independent contributor and at the time of publication had no position in the stocks mentioned.
