
 Yahoo Finance
 Does Tilly's, Inc.'s (NYSE:TLYS) CEO Pay Compare Well With Peers?

Ed Thomas became the CEO of Tilly's, Inc. (NYSE:TLYS) in 2015. This report will, first, examine the CEO compensation levels in comparison to CEO compensation at companies of similar size. After that, we will consider the growth in the business. And finally - as a second measure of performance - we will look at the returns shareholders have received over the last few years. The aim of all this is to consider the appropriateness of CEO pay levels.
View our latest analysis for Tilly's
How Does Ed Thomas's Compensation Compare With Similar Sized Companies?
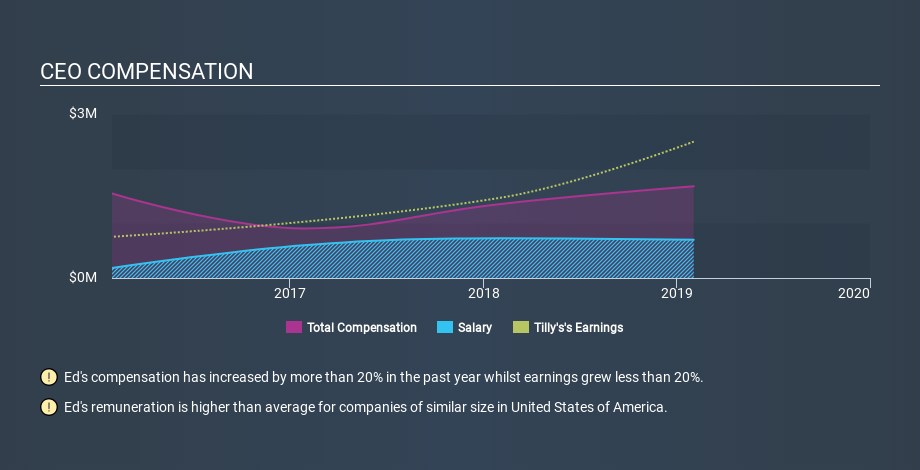
Our data indicates that Tilly's, Inc. is worth US$259m, and total annual CEO compensation was reported as US$1.7m for the year to February 2019. We think total compensation is more important but we note that the CEO salary is lower, at US$700k. When we examined a selection of companies with market caps ranging from US$100m to US$400m, we found the median CEO total compensation was US$1.1m.
Thus we can conclude that Ed Thomas receives more in total compensation than the median of a group of companies in the same market, and of similar size to Tilly's, Inc.. However, this doesn't necessarily mean the pay is too high. We can better assess whether the pay is overly generous by looking into the underlying business performance.
You can see a visual representation of the CEO compensation at Tilly's, below.
Is Tilly's, Inc. Growing?
Over the last three years Tilly's, Inc. has grown its earnings per share (EPS) by an average of 32% per year (using a line of best fit). Its revenue is up 4.3% over last year.
Overall this is a positive result for shareholders, showing that the company has improved in recent years. It's nice to see a little revenue growth, as this is consistent with healthy business conditions. It could be important to check this free visual depiction of what analysts expect for the future.
Has Tilly's, Inc. Been A Good Investment?
With a three year total loss of 12%, Tilly's, Inc. would certainly have some dissatisfied shareholders. So shareholders would probably think the company shouldn't be too generous with CEO compensation.
In Summary...
We examined the amount Tilly's, Inc. pays its CEO, and compared it to the amount paid by similar sized companies. As discussed above, we discovered that the company pays more than the median of that group.
However we must not forget that the EPS growth has been very strong over three years. However, the returns to investors are far less impressive, over the same period. While EPS is positive, we'd say shareholders would want better returns before the CEO is paid much more. Whatever your view on compensation, you might want to check if insiders are buying or selling Tilly's shares (free trial).
Important note: Tilly's may not be the best stock to buy. You might find something better in this list of interesting companies with high ROE and low debt.
If you spot an error that warrants correction, please contact the editor at editorial-team@simplywallst.com. This article by Simply Wall St is general in nature. It does not constitute a recommendation to buy or sell any stock, and does not take account of your objectives, or your financial situation. Simply Wall St has no position in the stocks mentioned.
We aim to bring you long-term focused research analysis driven by fundamental data. Note that our analysis may not factor in the latest price-sensitive company announcements or qualitative material. Thank you for reading.
