
 Yahoo Finance
 Does Synchrony Financial (NYSE:SYF) Have A Good P/E Ratio?

Want to participate in a research study? Help shape the future of investing tools and earn a $60 gift card!
This article is written for those who want to get better at using price to earnings ratios (P/E ratios). We'll look at Synchrony Financial's (NYSE:SYF) P/E ratio and reflect on what it tells us about the company's share price. Synchrony Financial has a P/E ratio of 8.65, based on the last twelve months. In other words, at today's prices, investors are paying $8.65 for every $1 in prior year profit.
View our latest analysis for Synchrony Financial
How Do You Calculate Synchrony Financial's P/E Ratio?
The formula for P/E is:
Price to Earnings Ratio = Share Price ÷ Earnings per Share (EPS)
Or for Synchrony Financial:
P/E of 8.65 = $32.5 ÷ $3.76 (Based on the year to December 2018.)
Is A High P/E Ratio Good?
A higher P/E ratio means that buyers have to pay a higher price for each $1 the company has earned over the last year. That is not a good or a bad thing per se, but a high P/E does imply buyers are optimistic about the future.
How Growth Rates Impact P/E Ratios
Earnings growth rates have a big influence on P/E ratios. That's because companies that grow earnings per share quickly will rapidly increase the 'E' in the equation. Therefore, even if you pay a high multiple of earnings now, that multiple will become lower in the future. Then, a lower P/E should attract more buyers, pushing the share price up.
Notably, Synchrony Financial grew EPS by a whopping 55% in the last year. And its annual EPS growth rate over 5 years is 2.1%. With that performance, I would expect it to have an above average P/E ratio.
How Does Synchrony Financial's P/E Ratio Compare To Its Peers?
The P/E ratio indicates whether the market has higher or lower expectations of a company. If you look at the image below, you can see Synchrony Financial has a lower P/E than the average (9.6) in the consumer finance industry classification.
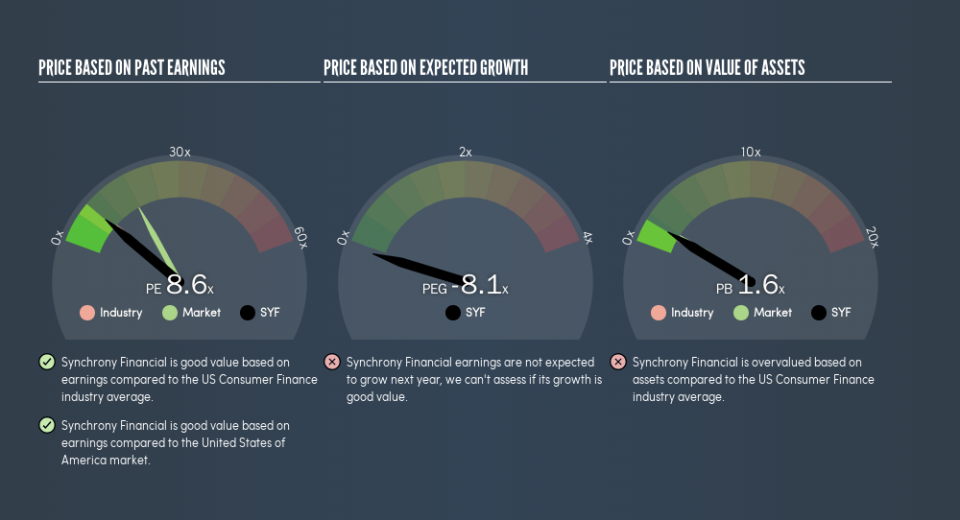
Synchrony Financial's P/E tells us that market participants think it will not fare as well as its peers in the same industry. Many investors like to buy stocks when the market is pessimistic about their prospects. You should delve deeper. I like to check if company insiders have been buying or selling.
Don't Forget: The P/E Does Not Account For Debt or Bank Deposits
Don't forget that the P/E ratio considers market capitalization. Thus, the metric does not reflect cash or debt held by the company. In theory, a company can lower its future P/E ratio by using cash or debt to invest in growth.
Such spending might be good or bad, overall, but the key point here is that you need to look at debt to understand the P/E ratio in context.
How Does Synchrony Financial's Debt Impact Its P/E Ratio?
Synchrony Financial's net debt is 63% of its market cap. This is enough debt that you'd have to make some adjustments before using the P/E ratio to compare it to a company with net cash.
The Bottom Line On Synchrony Financial's P/E Ratio
Synchrony Financial trades on a P/E ratio of 8.6, which is below the US market average of 17.9. While the EPS growth last year was strong, the significant debt levels reduce the number of options available to management. If the company can continue to grow earnings, then the current P/E may be unjustifiably low.
When the market is wrong about a stock, it gives savvy investors an opportunity. If it is underestimating a company, investors can make money by buying and holding the shares until the market corrects itself. So this free report on the analyst consensus forecasts could help you make a master move on this stock.
Of course you might be able to find a better stock than Synchrony Financial. So you may wish to see this free collection of other companies that have grown earnings strongly.
We aim to bring you long-term focused research analysis driven by fundamental data. Note that our analysis may not factor in the latest price-sensitive company announcements or qualitative material.
If you spot an error that warrants correction, please contact the editor at editorial-team@simplywallst.com. This article by Simply Wall St is general in nature. It does not constitute a recommendation to buy or sell any stock, and does not take account of your objectives, or your financial situation. Simply Wall St has no position in the stocks mentioned. Thank you for reading.
