
 Yahoo Finance
 Does Stantec Inc. (TSE:STN) Have A Volatile Share Price?

If you own shares in Stantec Inc. (TSE:STN) then it's worth thinking about how it contributes to the volatility of your portfolio, overall. In finance, Beta is a measure of volatility. Volatility is considered to be a measure of risk in modern finance theory. Investors may think of volatility as falling into two main categories. The first category is company specific volatility. This can be dealt with by limiting your exposure to any particular stock. The other type, which cannot be diversified away, is the volatility of the entire market. Every stock in the market is exposed to this volatility, which is linked to the fact that stocks prices are correlated in an efficient market.
Some stocks mimic the volatility of the market quite closely, while others demonstrate muted, exagerrated or uncorrelated price movements. Beta is a widely used metric to measure a stock's exposure to market risk (volatility). Before we go on, it's worth noting that Warren Buffett pointed out in his 2014 letter to shareholders that 'volatility is far from synonymous with risk.' Having said that, beta can still be rather useful. The first thing to understand about beta is that the beta of the overall market is one. A stock with a beta below one is either less volatile than the market, or more volatile but not corellated with the overall market. In comparison a stock with a beta of over one tends to be move in a similar direction to the market in the long term, but with greater changes in price.
View our latest analysis for Stantec
What does STN's beta value mean to investors?
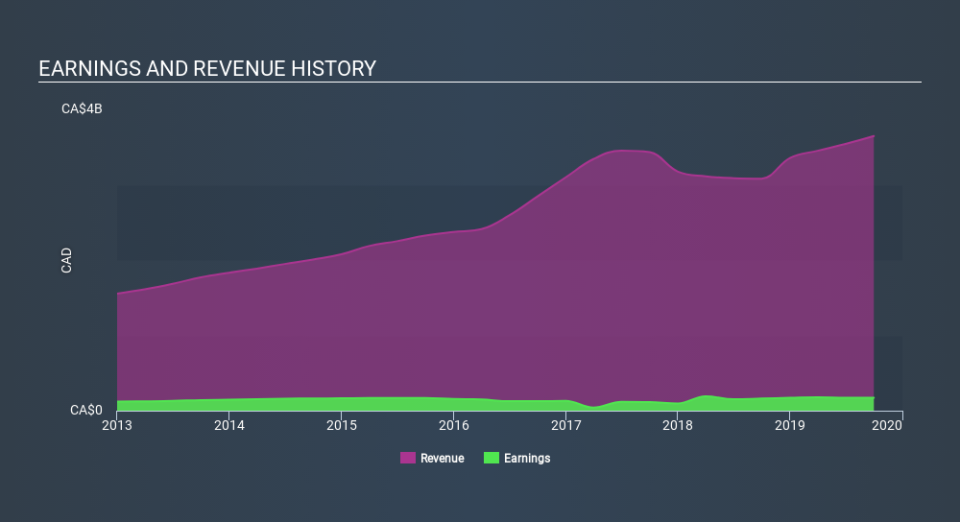
As it happens, Stantec has a five year beta of 1.05. This is fairly close to 1, so the stock has historically shown a somewhat similar level of volatility as the market. Using history as a guide, we might surmise that the share price is likely to be influenced by market voltility going forward but it probably won't be particularly sensitive to it. Many would argue that beta is useful in position sizing, but fundamental metrics such as revenue and earnings are more important overall. You can see Stantec's revenue and earnings in the image below.
How does STN's size impact its beta?
With a market capitalisation of CA$3.9b, Stantec is a pretty big company, even by global standards. It is quite likely well known to very many investors. We shouldn't be surprised to see a large company like this with a beta value quite close to the market average. Large companies often move roughly in line with the market. In part, that's because there are fewer individual events that are signficant enough to markedly change the value of the stock (compared to small companies, at least).
What this means for you:
Stantec has a beta value quite close to that of the overall market. That doesn't tell us much on its own, so it is probably worth considering whether the company is growing, if you're looking for stocks that will go up more than the overall market. In order to fully understand whether STN is a good investment for you, we also need to consider important company-specific fundamentals such as Stantec’s financial health and performance track record. I urge you to continue your research by taking a look at the following:
Future Outlook: What are well-informed industry analysts predicting for STN’s future growth? Take a look at our free research report of analyst consensus for STN’s outlook.
Past Track Record: Has STN been consistently performing well irrespective of the ups and downs in the market? Go into more detail in the past performance analysis and take a look at the free visual representations of STN's historicals for more clarity.
Other Interesting Stocks: It's worth checking to see how STN measures up against other companies on valuation. You could start with this free list of prospective options.
If you spot an error that warrants correction, please contact the editor at editorial-team@simplywallst.com. This article by Simply Wall St is general in nature. It does not constitute a recommendation to buy or sell any stock, and does not take account of your objectives, or your financial situation. Simply Wall St has no position in the stocks mentioned.
We aim to bring you long-term focused research analysis driven by fundamental data. Note that our analysis may not factor in the latest price-sensitive company announcements or qualitative material. Thank you for reading.
