
 Yahoo Finance
 Does Sparton Resources Inc’s (CVE:SRI) CEO Salary Reflect Performance?

Alan Barker took the helm as Sparton Resources Inc’s (TSXV:SRI) CEO and grew market cap to CA$8.51M recently. Understanding how CEOs are incentivised to run and grow their company is an important aspect of investing in a stock. This is because, if incentives are aligned, more value is created for shareholders which directly impacts your returns as an investor. Today we will assess Barker’s pay and compare this to the company’s performance over the same period, as well as measure it against other Canadian CEOs leading companies of similar size and profitability. See our latest analysis for Sparton Resources
Did Barker create value?
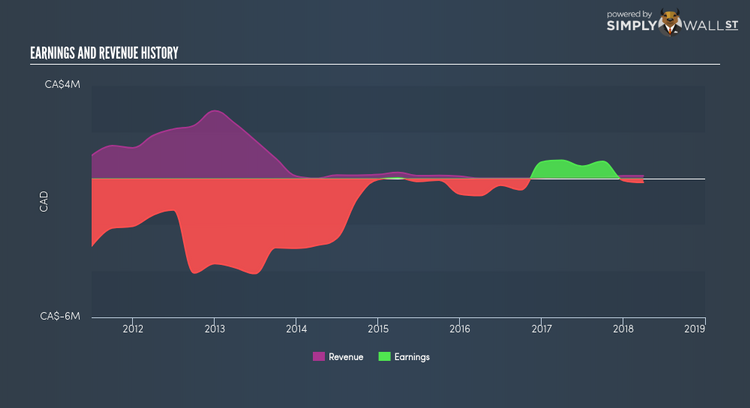
Performance can be measured based on factors such as earnings and total shareholder return (TSR). I believe earnings is a cleaner proxy, since many factors can impact share price, and therefore, TSR. Recently, SRI delivered negative earnings of -CA$177.25K , compared to the previous year’s positive earnings. Though, on average, SRI has been loss-making in the past, with a 5-year average EPS of -CA$0.013. In the situation of unprofitability the company may be incurring a period of reinvestment and growth, or it can be an indication of some headwind. In any case, CEO compensation should be reflective of the current condition of the business. From the latest financial report, Barker’s total compensation grew by 13.62% to CA$115.90K. Moreover, Barker’s pay is also made up of 16.00% non-cash elements, which means that fluctuations in SRI’s share price can move the true level of what the CEO actually takes home at the end of the day.
Is SRI’s CEO overpaid relative to the market?
Even though one size does not fit all, since remuneration should be tailored to the specific company and market, we can estimate a high-level base line to see if SRI deviates substantially from its peers. This outcome can help shareholders ask the right question about Barker’s incentive alignment. Typically, a Canadian small-cap is worth around $345M, creates earnings of $24M, and pays its CEO circa $770,000 per annum. Usually I would use earnings and market cap to account for variations in performance, however, SRI’s negative earnings lower the effectiveness of this method. Analyzing the range of remuneration for small-cap executives, it seems like Barker is remunerated sensibly relative to peers. Overall, although SRI is unprofitable, it seems like the CEO’s pay is sound.
Next Steps:
CEO pay is one of those topics of high controversy. Nonetheless, it should be talked about with full transparency from the board to shareholders. Is Barker remunerated appropriately based on other factors we have not covered today? Is this justified? As a shareholder, you should be aware of how those that represent you (i.e. the board of directors) make decisions on CEO pay and whether their incentives are aligned with yours. If you have not done so already, I highly recommend you to complete your research by taking a look at the following:
Governance: To find out more about SRI’s governance, look through our infographic report of the company’s board and management.
Financial Health: Does it have a healthy balance sheet? Take a look at our free balance sheet analysis with six simple checks on key factors like leverage and risk.
Other High-Growth Alternatives: Are there other high-growth stocks you could be holding instead of SRI? Explore our interactive list of stocks with large growth potential to get an idea of what else is out there you may be missing!
To help readers see pass the short term volatility of the financial market, we aim to bring you a long-term focused research analysis purely driven by fundamental data. Note that our analysis does not factor in the latest price sensitive company announcements.
The author is an independent contributor and at the time of publication had no position in the stocks mentioned.
