
 Yahoo Finance
 What Does Skechers USA Inc’s (NYSE:SKX) P/E Ratio Tell You?

This article is written for those who want to get better at using price to earnings ratios (P/E ratios). To keep it practical, we’ll show how Skechers USA Inc’s (NYSE:SKX) P/E ratio could help you assess the value on offer. Skechers U.S.A has a P/E ratio of 22.79, based on the last twelve months. In other words, at today’s prices, investors are paying $22.79 for every $1 in prior year profit.
Check out our latest analysis for Skechers U.S.A
How Do You Calculate A P/E Ratio?
The formula for price to earnings is:
Price to Earnings Ratio = Price per Share ÷ Earnings per Share (EPS)
Or for Skechers U.S.A:
P/E of 22.79 = $27.29 ÷ $1.2 (Based on the year to September 2018.)
Is A High Price-to-Earnings Ratio Good?
A higher P/E ratio means that investors are paying a higher price for each $1 of company earnings. That isn’t necessarily good or bad, but a high P/E implies relatively high expectations of what a company can achieve in the future.
How Growth Rates Impact P/E Ratios
Companies that shrink earnings per share quickly will rapidly decrease the ‘E’ in the equation. That means unless the share price falls, the P/E will increase in a few years. So while a stock may look cheap based on past earnings, it could be expensive based on future earnings.
Skechers U.S.A shrunk earnings per share by 26% over the last year. But over the longer term (5 years) earnings per share have increased by 16%. And it has shrunk its earnings per share by 11% per year over the last three years. This growth rate might warrant a low P/E ratio. This might lead to low expectations.
How Does Skechers U.S.A’s P/E Ratio Compare To Its Peers?
We can get an indication of market expectations by looking at the P/E ratio. You can see in the image below that the average P/E (20.3) for companies in the luxury industry is lower than Skechers U.S.A’s P/E.
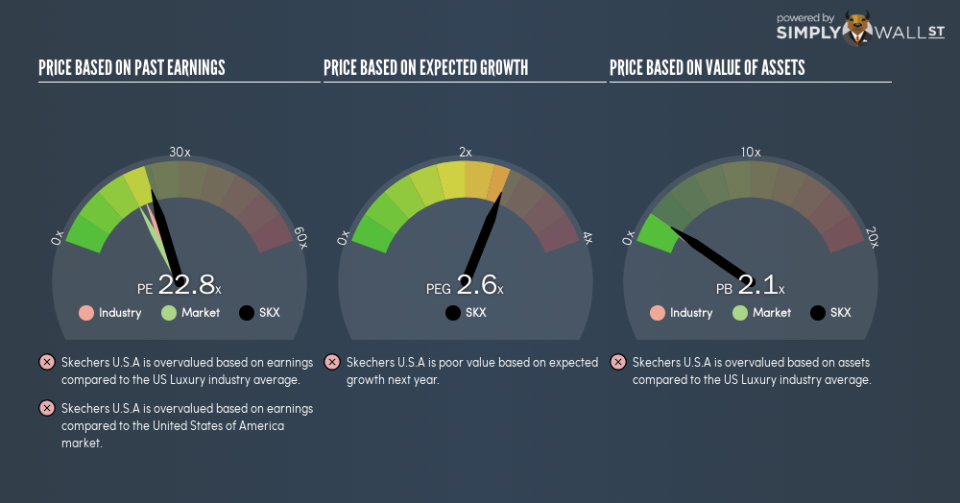
Its relatively high P/E ratio indicates that Skechers U.S.A shareholders think it will perform better than other companies in its industry classification. The market is optimistic about the future, but that doesn’t guarantee future growth. So investors should always consider the P/E ratio alongside other factors, such as whether company directors have been buying shares.
A Limitation: P/E Ratios Ignore Debt and Cash In The Bank
It’s important to note that the P/E ratio considers the market capitalization, not the enterprise value. Thus, the metric does not reflect cash or debt held by the company. In theory, a company can lower its future P/E ratio by using cash or debt to invest in growth.
Such expenditure might be good or bad, in the long term, but the point here is that the balance sheet is not reflected by this ratio.
Skechers U.S.A’s Balance Sheet
Skechers U.S.A has net cash of US$803m. That should lead to a higher P/E than if it did have debt, because its strong balance sheets gives it more options.
The Verdict On Skechers U.S.A’s P/E Ratio
Skechers U.S.A has a P/E of 22.8. That’s higher than the average in the US market, which is 17.9. The recent drop in earnings per share might keep value investors away, but the healthy balance sheet means the company retains potential for future growth. If fails to eventuate, the current high P/E could prove to be temporary, as the share price falls.
When the market is wrong about a stock, it gives savvy investors an opportunity. As value investor Benjamin Graham famously said, ‘In the short run, the market is a voting machine but in the long run, it is a weighing machine.’ So this free visualization of the analyst consensus on future earnings could help you make the right decision about whether to buy, sell, or hold.
You might be able to find a better buy than Skechers U.S.A. If you want a selection of possible winners, check out this free list of interesting companies that trade on a P/E below 20 (but have proven they can grow earnings).
To help readers see past the short term volatility of the financial market, we aim to bring you a long-term focused research analysis purely driven by fundamental data. Note that our analysis does not factor in the latest price-sensitive company announcements.
The author is an independent contributor and at the time of publication had no position in the stocks mentioned. For errors that warrant correction please contact the editor at editorial-team@simplywallst.com.
