
 Yahoo Finance
 How Does Seacor Holdings's (NYSE:CKH) P/E Compare To Its Industry, After The Share Price Drop?

To the annoyance of some shareholders, Seacor Holdings (NYSE:CKH) shares are down a considerable 36% in the last month. Indeed the recent decline has arguably caused some bitterness for shareholders who have held through the 40% drop over twelve months.
All else being equal, a share price drop should make a stock more attractive to potential investors. While the market sentiment towards a stock is very changeable, in the long run, the share price will tend to move in the same direction as earnings per share. The implication here is that long term investors have an opportunity when expectations of a company are too low. Perhaps the simplest way to get a read on investors' expectations of a business is to look at its Price to Earnings Ratio (PE Ratio). A high P/E implies that investors have high expectations of what a company can achieve compared to a company with a low P/E ratio.
View our latest analysis for Seacor Holdings
How Does Seacor Holdings's P/E Ratio Compare To Its Peers?
We can tell from its P/E ratio of 17.96 that there is some investor optimism about Seacor Holdings. The image below shows that Seacor Holdings has a higher P/E than the average (10.0) P/E for companies in the energy services industry.
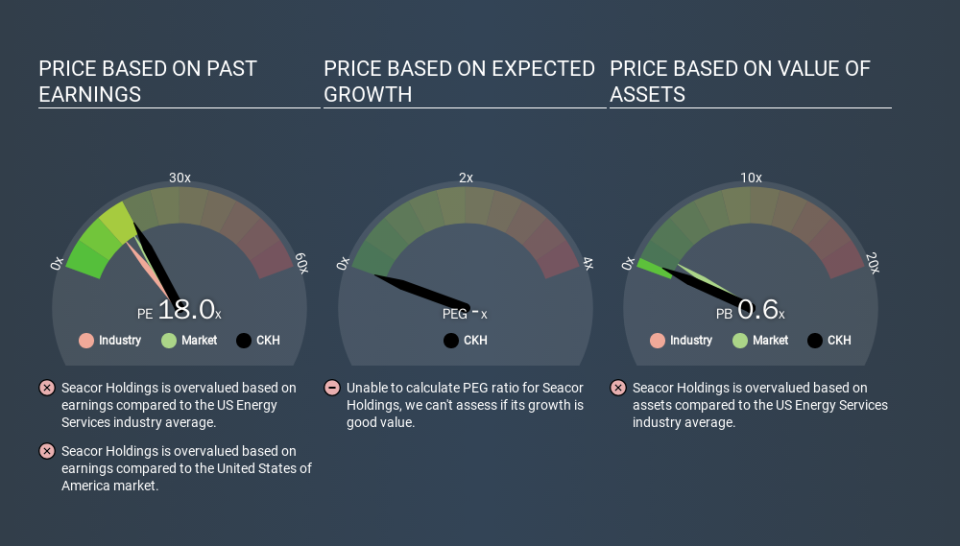
Its relatively high P/E ratio indicates that Seacor Holdings shareholders think it will perform better than other companies in its industry classification. Clearly the market expects growth, but it isn't guaranteed. So investors should delve deeper. I like to check if company insiders have been buying or selling.
How Growth Rates Impact P/E Ratios
Probably the most important factor in determining what P/E a company trades on is the earnings growth. Earnings growth means that in the future the 'E' will be higher. That means even if the current P/E is high, it will reduce over time if the share price stays flat. A lower P/E should indicate the stock is cheap relative to others -- and that may attract buyers.
Seacor Holdings's earnings per share fell by 56% in the last twelve months. And over the longer term (5 years) earnings per share have decreased 23% annually. This growth rate might warrant a below average P/E ratio.
Don't Forget: The P/E Does Not Account For Debt or Bank Deposits
The 'Price' in P/E reflects the market capitalization of the company. In other words, it does not consider any debt or cash that the company may have on the balance sheet. Theoretically, a business can improve its earnings (and produce a lower P/E in the future) by investing in growth. That means taking on debt (or spending its cash).
Spending on growth might be good or bad a few years later, but the point is that the P/E ratio does not account for the option (or lack thereof).
How Does Seacor Holdings's Debt Impact Its P/E Ratio?
Seacor Holdings's net debt equates to 45% of its market capitalization. While that's enough to warrant consideration, it doesn't really concern us.
The Verdict On Seacor Holdings's P/E Ratio
Seacor Holdings trades on a P/E ratio of 18.0, which is above its market average of 15.1. With some debt but no EPS growth last year, the market has high expectations of future profits. What can be absolutely certain is that the market has become significantly less optimistic about Seacor Holdings over the last month, with the P/E ratio falling from 28.1 back then to 18.0 today. For those who prefer to invest with the flow of momentum, that might be a bad sign, but for a contrarian, it may signal opportunity.
Investors have an opportunity when market expectations about a stock are wrong. People often underestimate remarkable growth -- so investors can make money when fast growth is not fully appreciated. So this free report on the analyst consensus forecasts could help you make a master move on this stock.
But note: Seacor Holdings may not be the best stock to buy. So take a peek at this free list of interesting companies with strong recent earnings growth (and a P/E ratio below 20).
If you spot an error that warrants correction, please contact the editor at editorial-team@simplywallst.com. This article by Simply Wall St is general in nature. It does not constitute a recommendation to buy or sell any stock, and does not take account of your objectives, or your financial situation. Simply Wall St has no position in the stocks mentioned.
We aim to bring you long-term focused research analysis driven by fundamental data. Note that our analysis may not factor in the latest price-sensitive company announcements or qualitative material. Thank you for reading.
