
 Yahoo Finance
 Does The RMR Group Inc. (NASDAQ:RMR) Have A Good P/E Ratio?

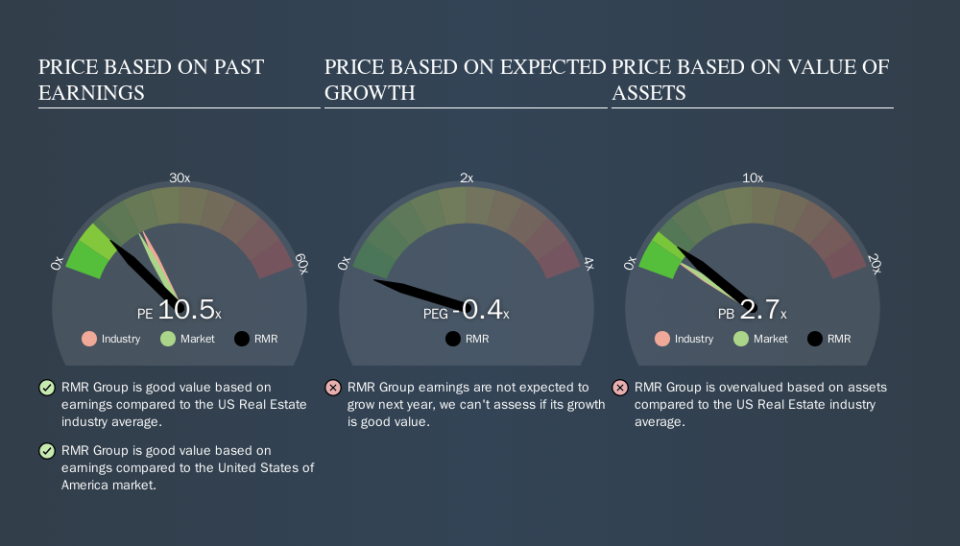
Today, we'll introduce the concept of the P/E ratio for those who are learning about investing. We'll show how you can use The RMR Group Inc.'s (NASDAQ:RMR) P/E ratio to inform your assessment of the investment opportunity. RMR Group has a P/E ratio of 10.46, based on the last twelve months. That means that at current prices, buyers pay $10.46 for every $1 in trailing yearly profits.
Check out our latest analysis for RMR Group
How Do I Calculate A Price To Earnings Ratio?
The formula for price to earnings is:
Price to Earnings Ratio = Share Price ÷ Earnings per Share (EPS)
Or for RMR Group:
P/E of 10.46 = $48 ÷ $4.59 (Based on the trailing twelve months to June 2019.)
Is A High P/E Ratio Good?
A higher P/E ratio means that investors are paying a higher price for each $1 of company earnings. All else being equal, it's better to pay a low price -- but as Warren Buffett said, 'It's far better to buy a wonderful company at a fair price than a fair company at a wonderful price.'
How Does RMR Group's P/E Ratio Compare To Its Peers?
The P/E ratio indicates whether the market has higher or lower expectations of a company. If you look at the image below, you can see RMR Group has a lower P/E than the average (19.3) in the real estate industry classification.
RMR Group's P/E tells us that market participants think it will not fare as well as its peers in the same industry. While current expectations are low, the stock could be undervalued if the situation is better than the market assumes. It is arguably worth checking if insiders are buying shares, because that might imply they believe the stock is undervalued.
How Growth Rates Impact P/E Ratios
Probably the most important factor in determining what P/E a company trades on is the earnings growth. Earnings growth means that in the future the 'E' will be higher. And in that case, the P/E ratio itself will drop rather quickly. So while a stock may look expensive based on past earnings, it could be cheap based on future earnings.
RMR Group's earnings per share fell by 20% in the last twelve months. But EPS is up 27% over the last 3 years.
Don't Forget: The P/E Does Not Account For Debt or Bank Deposits
The 'Price' in P/E reflects the market capitalization of the company. Thus, the metric does not reflect cash or debt held by the company. Hypothetically, a company could reduce its future P/E ratio by spending its cash (or taking on debt) to achieve higher earnings.
Spending on growth might be good or bad a few years later, but the point is that the P/E ratio does not account for the option (or lack thereof).
How Does RMR Group's Debt Impact Its P/E Ratio?
With net cash of US$377m, RMR Group has a very strong balance sheet, which may be important for its business. Having said that, at 26% of its market capitalization the cash hoard would contribute towards a higher P/E ratio.
The Verdict On RMR Group's P/E Ratio
RMR Group's P/E is 10.5 which is below average (18) in the US market. The recent drop in earnings per share would make investors cautious, the relatively strong balance sheet will allow the company time to invest in growth. If it achieves that, then there's real potential that the low P/E could eventually indicate undervaluation.
Investors should be looking to buy stocks that the market is wrong about. If it is underestimating a company, investors can make money by buying and holding the shares until the market corrects itself. So this free visual report on analyst forecasts could hold the key to an excellent investment decision.
Of course you might be able to find a better stock than RMR Group. So you may wish to see this free collection of other companies that have grown earnings strongly.
We aim to bring you long-term focused research analysis driven by fundamental data. Note that our analysis may not factor in the latest price-sensitive company announcements or qualitative material.
If you spot an error that warrants correction, please contact the editor at editorial-team@simplywallst.com. This article by Simply Wall St is general in nature. It does not constitute a recommendation to buy or sell any stock, and does not take account of your objectives, or your financial situation. Simply Wall St has no position in the stocks mentioned. Thank you for reading.
