
 Yahoo Finance
 Does Public Service Enterprise Group Incorporated's (NYSE:PEG) Debt Level Pose A Problem?

Want to participate in a short research study? Help shape the future of investing tools and you could win a $250 gift card!
There are a number of reasons that attract investors towards large-cap companies such as Public Service Enterprise Group Incorporated (NYSE:PEG), with a market cap of US$30b. One reason being its ‘too big to fail’ aura which gives it the appearance of a strong and stable investment. But, the key to extending previous success is in the health of the company’s financials. I will provide an overview of Public Service Enterprise Group’s financial liquidity and leverage to give you an idea of Public Service Enterprise Group’s position to take advantage of potential acquisitions or comfortably endure future downturns. Remember this is a very top-level look that focuses exclusively on financial health, so I recommend a deeper analysis into PEG here.
View our latest analysis for Public Service Enterprise Group
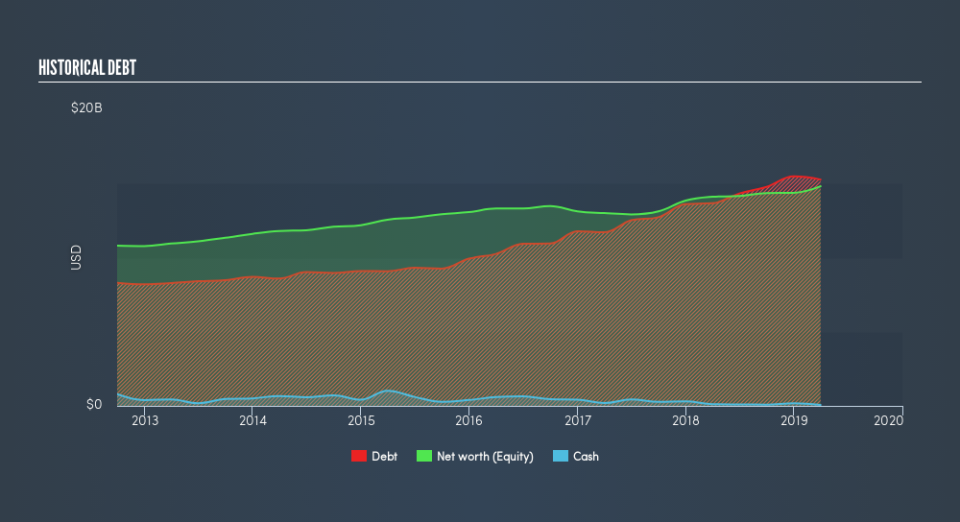
Does PEG Produce Much Cash Relative To Its Debt?
PEG has built up its total debt levels in the last twelve months, from US$14b to US$16b , which accounts for long term debt. With this growth in debt, PEG currently has US$66m remaining in cash and short-term investments to keep the business going. Additionally, PEG has produced US$3.0b in operating cash flow over the same time period, resulting in an operating cash to total debt ratio of 19%, meaning that PEG’s operating cash is less than its debt.
Can PEG meet its short-term obligations with the cash in hand?
With current liabilities at US$4.5b, it seems that the business arguably has a rather low level of current assets relative its obligations, with the current ratio last standing at 0.68x. The current ratio is the number you get when you divide current assets by current liabilities.
Does PEG face the risk of succumbing to its debt-load?
Considering Public Service Enterprise Group’s total debt outweighs its equity, the company is deemed highly levered. This is not unusual for large-caps since debt tends to be less expensive than equity because interest payments are tax deductible. Accordingly, large companies often have lower cost of capital due to easily obtained financing, providing an advantage over smaller companies. By measuring how many times PEG’s earnings can cover interest payments, we can evaluate whether its level of debt is sustainable or not. Ideally, earnings before interest and tax (EBIT) should cover net interest by at least three times. For PEG, the ratio of 5.4x suggests that interest is appropriately covered. Large-cap investments like PEG are often believed to be a safe investment due to their ability to pump out ample earnings multiple times its interest payments.
Next Steps:
With a high level of debt on its balance sheet, PEG could still be in a financially strong position if its cash flow also stacked up. However, this isn’t the case, and there’s room for PEG to increase its operational efficiency. In addition to this, its low liquidity raises concerns over whether current asset management practices are properly implemented for the large-cap. Keep in mind I haven't considered other factors such as how PEG has been performing in the past. I suggest you continue to research Public Service Enterprise Group to get a more holistic view of the stock by looking at:
Future Outlook: What are well-informed industry analysts predicting for PEG’s future growth? Take a look at our free research report of analyst consensus for PEG’s outlook.
Valuation: What is PEG worth today? Is the stock undervalued, even when its growth outlook is factored into its intrinsic value? The intrinsic value infographic in our free research report helps visualize whether PEG is currently mispriced by the market.
Other High-Performing Stocks: Are there other stocks that provide better prospects with proven track records? Explore our free list of these great stocks here.
We aim to bring you long-term focused research analysis driven by fundamental data. Note that our analysis may not factor in the latest price-sensitive company announcements or qualitative material.
If you spot an error that warrants correction, please contact the editor at editorial-team@simplywallst.com. This article by Simply Wall St is general in nature. It does not constitute a recommendation to buy or sell any stock, and does not take account of your objectives, or your financial situation. Simply Wall St has no position in the stocks mentioned. Thank you for reading.
